


S&P 500, Dollar, USDJPY, Gold Points:
- Following volatility spurred by a US trade representatives evaluation of the US-China trade status, risk appetite extended further than otherwise would have been expected
- The US Dollar spent a second day under serious pressure, but is this a charged bear trend backed by issues like a localized pandemic resurgence or mere range restriction?
- After PMI data warmed the growth forecast, the next scheduled theme will be monetary policy as a range of banks (ECB, BOE, BOJ, SNB) offer non-monetary policy updates before the Fed’s stress test results
Risk Trends Fail to Clear Range Even with a Charge
Whether or not you felt the fundamental backdrop was absolutely favorable – to bulls – or not, there was nevertheless a charge to capital market performance this past session. Between the unlikely impact that the US-China trade headlines affected to the more straightforward support of the global PMI updates, risk appetite trends had a foothold to find in the markets. For me, the most indicative reading for speculative appetite – one that is as flawed as speculative appetite itself – was the S&P 500. The US index would again lead the charge symbolically with a gap to the upside Tuesday, but it would lose traction before the popular index would clear the range it has fleshed out the past week. With extended submission to the range (3,155 to 3,080), we are left with the most restrictive trading range since early February, before the Pandemic volatility began.
| Change in | Longs | Shorts | OI |
| Daily | 1% | -1% | 0% |
| Weekly | 15% | -13% | -1% |
Chart of the S&P 500 with 100 and 200-Day Moving Average and 6-Day Range (Daily Chart)
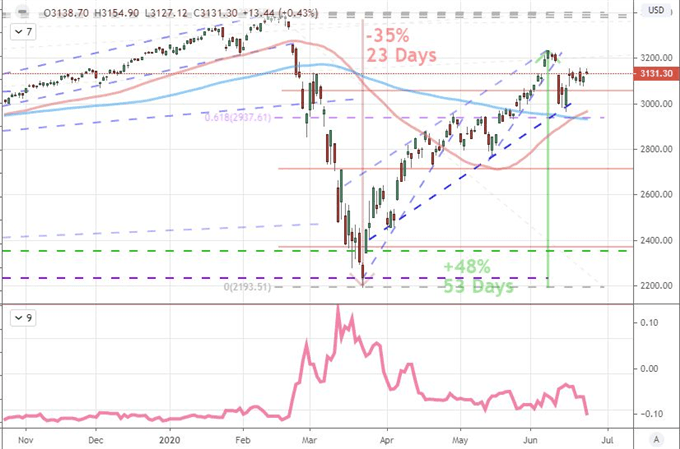
Chart Created on Tradingview Platform
The restraint on range for the likes of the S&P 500 is reassuring for some that speculation is not running rampant, but I believe the indulgence is still showing through. While the SPX and Dow are still a short distance from their respective record highs, the tech-heavy Nasdaq 100 managed to push record highs yet again. The ratio of the Nasdaq to the blue-chip Dow reflects the errant speculative reach in the market. The same concentration is present in the FAANG grouping performance which also pushed a new peak, one that I believe is fostered by sheer market-building momentum rather than a sense of value.
Chart of the Nasdaq to Dow Ratio Overlaid with FAANG Index (Daily Chart)
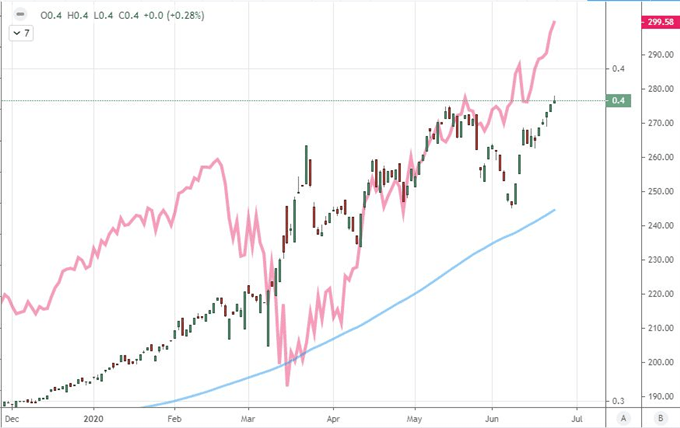
Chart Created on Tradingview Platform
Another Short-Term Fundamental Boost
For those that believe the markets are stretching to increasingly irrational heights, there is nevertheless a fundamental line that is guiding expectations forward. The question is: how long these unlikely motivators can keep the market bolstered? The most remarkable driver into Tuesday was the walk back from officials that the US-China trade deal was falling through. White House adviser Peter Navarro offered remarks that insinuated exactly that, which led to a rally for USDCNH and drop for risk assets overnight. Yet, this quick walk back would do more than encourage the markets back to their original balance point; risk appetite seemed to reach further in the recovery than it would have had no initial issue been present. This is not an uncommon ‘manufactured resolution’ motivator for optimism that we have seen these past years, but I am skeptical on how far it will carry us.
Chart of USDCNH with Size of Daily ‘Wicks’ or ‘Tails’ (Daily)
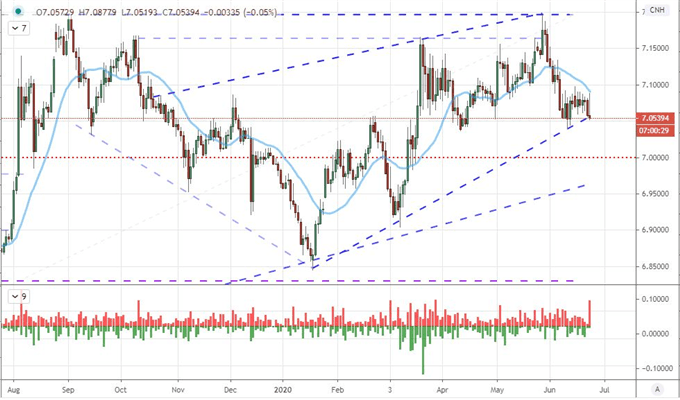
Chart Created on Tradingview Platform
More traditional a fundamental motivator this past session was the run of better-than-expected readings from the June global PMIs reported by Markit. These timely proxies for economic activity showed the major developed world centers were tracking out robust recoveries from the trough signaled through the April. For the optimists, readings so close to 50 (the tipping point of contraction to growth) reinforces the expectation that we are course for a ‘V-shaped’ recovery, but I still believe that to be overindulgent an outlook. I don’t think this round of support – as global as the story may have been – will be what extends global risk appetite higher.
Chart of US Composite PMI Overlaid with Quarterly GDP (Monthly)
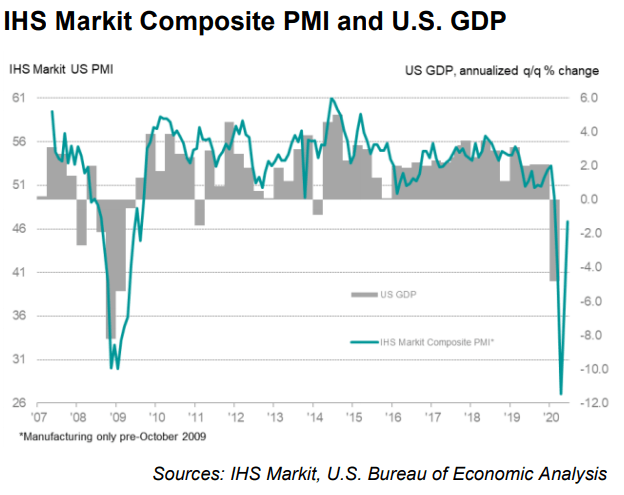
Chart from Markit Economics Website
The Fundamental Milestone and Charged Market Movers Ahead
On the fundamental side, I still see the persistent updates in the form of global coronavirus cases the most capable tipping point for the speculative masses. It is always possible that there be a sudden reversal in trend of cases such that they permanently head lower, but that does not seem likely given the reopening of key economies the world over. More likely, the new cases continue to push to record high led by key countries like the United States. It is interesting however that we heard White House economic adviser Larry Kudlow stated that there ‘absolutely, definitely’ would not be a second nationwide lockdown. That may be seen a boon to averting a return to forced recession, but the public fear and private business response to a second wave of the pandemic could bring economic contraction without the order of a clear government guideline.
Graph of Worldwide Cases of Coronavirus (Daily)
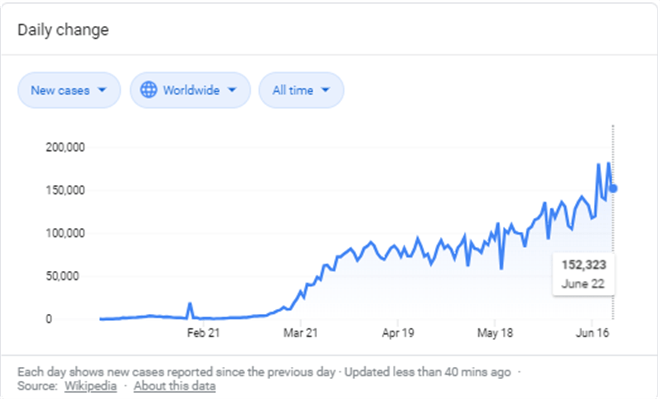
Chart from Google with Data from Wikipedia
Looking over Wednesday’s docket, there is another theme on tap that will likely draw our attention; but which I do not think will have its proper traction until the following trading day. Monetary policy will have its time in the sun starting with the Reserve Bank of New Zealand rate decision. The most recognizable, traditional policy update from a ‘major’ central bank this week; this event is good for a possible Kiwi response, but not a global promotion of risk trends. Meanwhile, non-monetary policy updates from the likes of the ECB, BOE, BOJ and SNB will offer important insight into growth and financial assessments. As important as these updates are, they are unlikely to stray far from what we have heard from each these past weeks.
Chart of Major Central Banks Aggregate Balance Sheet and S&P 500 (Monthly)
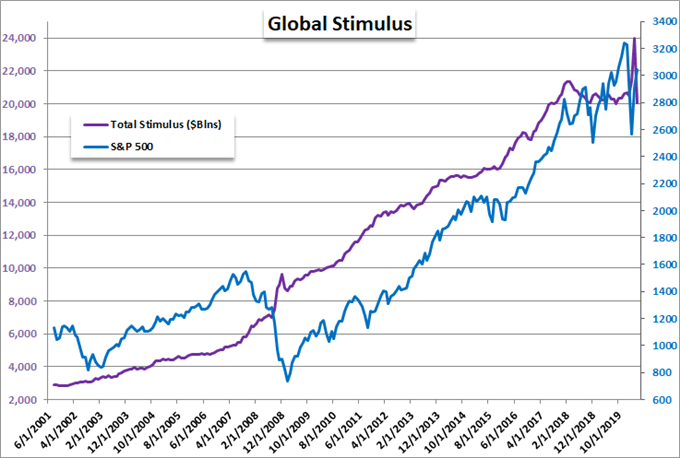
Chart Created by John Kicklighter with data from Bloomberg
The real impact on the monetary policy theme will not likely come into play until Thursday when the Federal Reserve is due to drop the results of its bank stress test effort. With the added evaluation of the pandemic and recession, there are scenarios that will spur the imagination. The Dollar is already under pressure with a strong retreat from DXY which has short circuited breaks from the likes of EURUSD, AUDUSD and NZDUSD. For dollar-based Gold, the boost has pushed a new multi-year high; but this anti-Greenback proposition is likely as fraught as the failed bullish move as markets are broadly struggling for conviction.
| Change in | Longs | Shorts | OI |
| Daily | 1% | -3% | -1% |
| Weekly | 2% | -8% | -2% |
Chart of Gold (Daily)
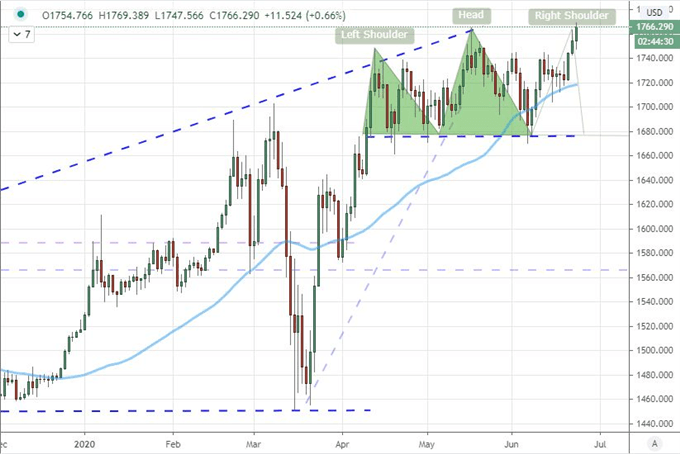
Chart Created on Tradingview Platform

If you want to download my Manic-Crisis calendar, you can find the updated file here.
.


