


Nasdaq, EURUSD, USDCNH Talking Points:
- Risk assets finally broke their stride as the S&P 500 posted its first drop in 5 days, Dow stalled at its 200-day moving average and Nasdaq failed to break a record
- EURUSD has advanced for 8 consecutive trading days following the ECB’s upgrade to its stimulus effort – a 600 billion euro increase to push PEPP to 1.35 trillion euros
- Top event risk Friday is May NFPs, but the ability of this singular event risk to tip a clear trend for the likes of the NDX is questionable
Finally, A Breather in Risk Trends and Nasdaq Teetering on Conviction
The benchmarks for risk appetite have charged higher through much of this week – often flagrantly defying overt fundamental risks. However, the breaks were hit on that rally this past session as correlation across sentiment-laden measures uniformly eased back. While there was step back from the likes of emerging market assets (EEM), carry trade and global indices (such as the VEU rest of world ETF); few measures were as remarkable in their technical timing as the major US stock measures. The S&P 500 posted its first daily loss in five trading sessions – ending the longest streak since early February. The Dow stalled at its 200-day moving average around 26,300. Yet, the most provocative picture was from the Nasdaq 100 which notched an intraday record high but not a record close. Meanwhile, support chasing up an accelerated rising wedge seems to pressure a decision on conviction: bullish or bearish?
Chart of Nasdaq 100 Index with 20-Day Moving Average (Daily Chart)
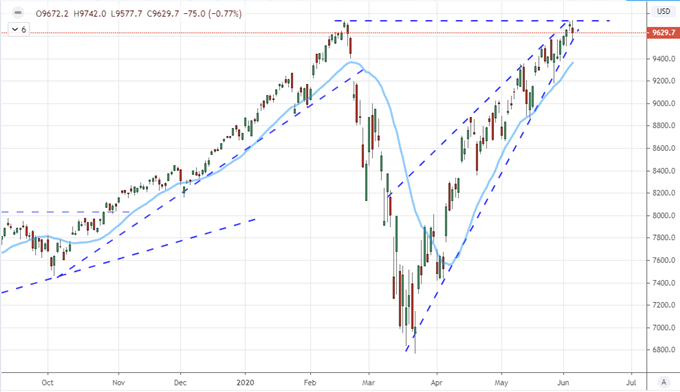
Chart Created on Tradingview Platform
When considering conviction, the principal considerations are price-based progress and fundamental runway. There are few more urgent milestones than what the Nasdaq 100 shows. Given the index’s 10 and 20-day average true range (ATR) measures, a break seems very likely through Friday’s close – and if not then, Monday. That said, breaks have not ensured follow through lately. Conviction is an elusive factor in these markets. While skepticism has softened over the past few months, there remains a majority in those I poll that we are still in a corrective phase in a larger bear trend. In my Twitter poll, 61 percent of those that responded believe we are still in a larger bear market (with SPX as a benchmark) that is simply on a temporary digression.
| Change in | Longs | Shorts | OI |
| Daily | 1% | -1% | 0% |
| Weekly | 15% | -13% | -1% |
Twitter Poll of S&P 500 Bull or Bear Market
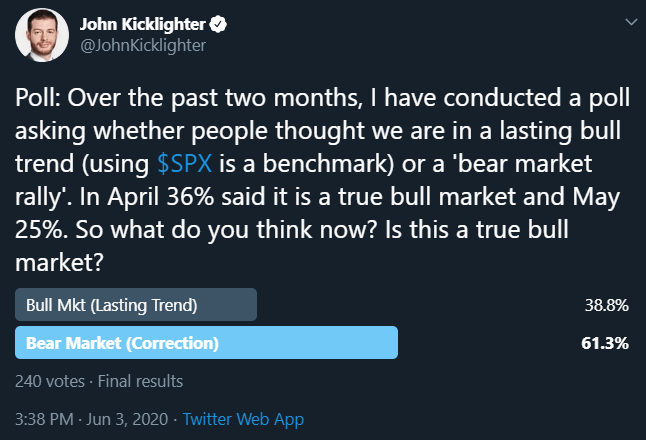
Poll from Twitter, @johnkicklighter
Euro Rally Extends as ECB Amplifies Stimulus, NFPs on Tap for Friday
For more systemic moves than what is showing through in general risk trends, there are few more impressive moves than the benchmark EURUSD. The world’s most liquid FX pair – and arguably most liquid asset – extended its climb to an eighth consecutive day’s rally. That is the longest rally since 2009 which deserves a closer look even from the purist fundamental trader in unrelated asset classes. This volatility is an extraordinary departure from the conditions we had grown so accustomed to before March’s fireworks. Before the pandemic-sparked volatility, the average longer-duration volatility measures from the pair was the lowest since the shared currency began trading. This is an undeniable climb, but perhaps it is also more data dependent – which would put its momentum at the whims of the economic calendar and interpretation of key updates.
| Change in | Longs | Shorts | OI |
| Daily | -1% | -4% | -3% |
| Weekly | 4% | -10% | -5% |
Chart of EURUSD with Equally-Weighted Euro Index and Consecutive Candle Count (Daily)
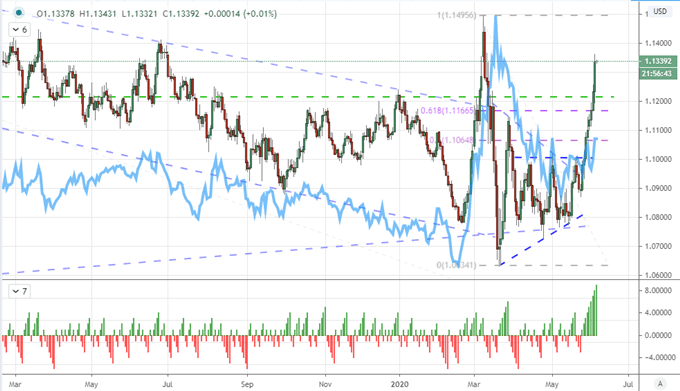
Chart Created on Tradingview Platform
On Thursday, the top event risk was undoubtedly the ECB rate decision. Following the RBA and BOC decisions before it this week, the European Central Bank policy update carried more systemic weight. This key player in the global spectrum was carrying significant speculation for fresh support as Europe has shown some of the most unmistakable struggle economically. Against a backdrop of an anticipated -8.7 percent contraction (baseline), the group announced it was increasing bond purchases by 600 billion euros. Historically, more stimulus has sent currency’s sliding; but at present, it is seen as a driver for faster economic reversal and thereby bullish. The question naturally turns to Friday’s top event risk: May US nonfarm payrolls (NFPs). Will this data spur a 10th day advance? Will the market treat anything less than an 8 million position figure loss in jobs as a ‘favorable outcome’? That remains to be seen.
Chart of EURUSD with 3-Week Rate of Change (Weekly)
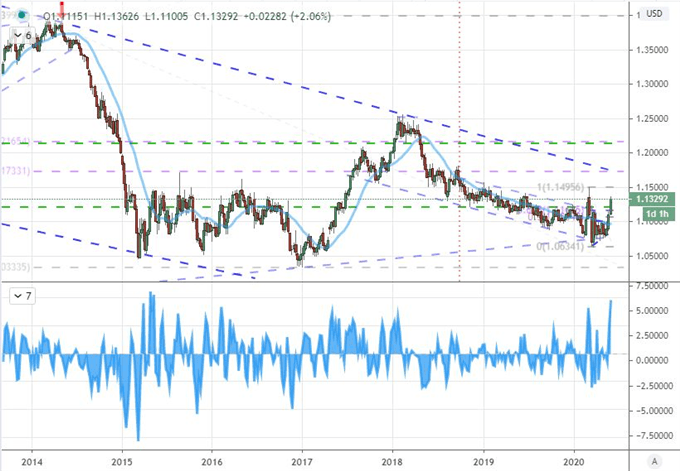
Chart Created on Tradingview Platform
What Will Tip the Risk Scales – American Airlines May Give a Clue
While the NFPs will attract a lot of attention from market participants, its fundamental heft leaves a lot to be desired. There are systemic issues of much greater merit and a market that seems to be very selective in what it wants to prioritize. The depth of the global recession for example is proving just as troubling as so many updates these past months have suggested. And yet, the market seems to put greater weight behind the marginal improvements from these deep crises figures – a preference that maintains the buoyancy in speculative assets. A great example of this forward looking prioritization was American Airlines whose shares posted one of the biggest single-day rallies in its history as investors assessed the end of the global lockdown and worst of the curb on global air travel. Is that reasonable? That’s questionable, but the price action is undeniable.
Chart of American Airlines Stock with 20-Day Moving Average (Daily)
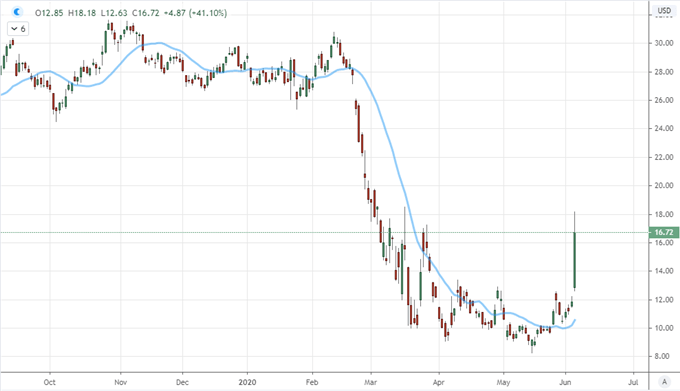
Chart Created on Tradingview Platform
Speculative bias is a factor that must always be considered, but fundamental themes can vary for interpretation. Trade wars is another matter of serious concern that could readily retake control of global sentiment. This past session, US Secretary of State Mike Pompeo praised Nasdaq for determining all firms listed on its exchange comply to the same auditing and exchange rules – a determination clearly aimed at Chinese companies. USDCNH is a pair to watch on this front. Monetary policy is another matter to consider with the Fed just over the horizon next Wednesday. The most ominous and abstract consideration at the moment though seems geopolitical issues as the US advances to the November elections with an administration clearly interested in affecting a fast reversal of fortunes…at potentially all costs.
Chart of USDCNH with 50-Day Moving Average (Daily)
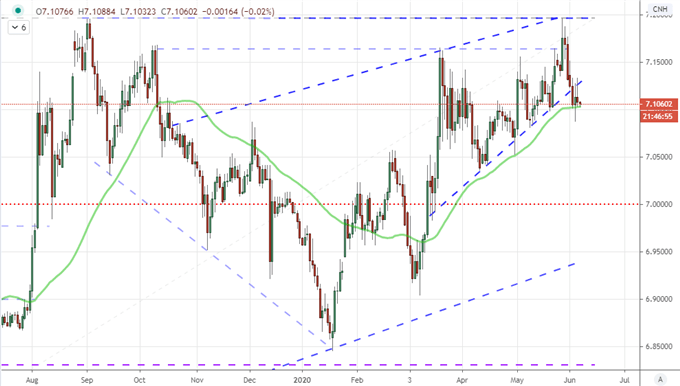
Chart Created on Tradingview Platform

If you want to download my Manic-Crisis calendar, you can find the updated file here.
.


