


S&P 500, Crude Oil, EURUSD Talking Points:
- Recession fears have gained traction through polls and in anticipation of April PMIs (Thursday) but can earnings and fresh US stimulus shift the tides?
- The May WTI futures contract has expired, but that doesn’t seem to have alleviated the problems for crude as the market continued to drop
- Approval of $484 billion in fresh US stimulus and a scheduled meeting for the ECB to discuss ‘junk’ bonds as collateral should put EURUSD in in focus
Risk Trends May Find A Recharge for Wednesday
There was an unmistakable measure of ‘risk aversion’ through this past session with a number of fundamental updates that could serve as ready fodder for those looking for a reason to unwind a loosely held risk trade. The foundation for the risk aversion, however, looks to be a combination of a speculative upswing that was winded against a backdrop of recession alongside the systemic inferences from the troubles in the global crude oil market. Following measurable losses in altitude from the Asian and European sessions, the S&P 500 opened the past session with a gap down and further loss through the close to eventually tally a 3.1 percent drop. This was the biggest single-day loss since April 1st, which was itself a temporary slump. Whether or not this swoon turns into more committed risk aversion will likely be determined over the next 24 hours.
| Change in | Longs | Shorts | OI |
| Daily | 1% | -1% | 0% |
| Weekly | 15% | -13% | -1% |
Chart of S&P 500 Emini Futures with Daily Gaps and Rate of Change (Daily)
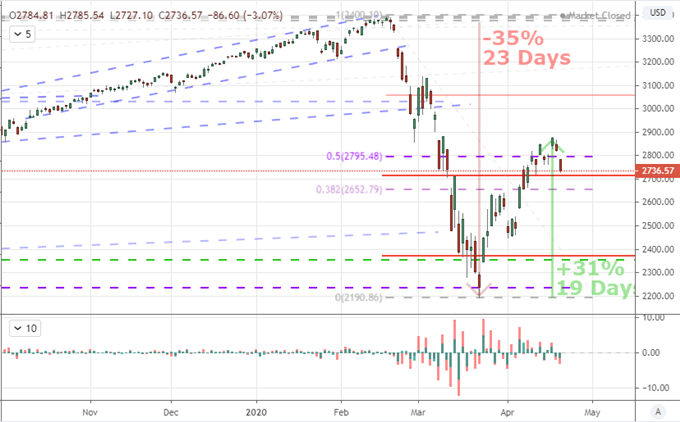
Chart Created on Tradingview Platform
It is possible that the speculative compass shifts courses heading into Wednesday’s session thanks to a couple of after-hours developments in the US markets. On the one hand, we have the earnings figures from tech-giant Netflix. The FAANG member released earnings after the New York close Tuesday and reported a greater-than-expected surge in subscribers to the tune of 15.8 million users versus the 7.2 million forecasted. This is one of the companies better positioned to skirt the economic scourge of social distancing and economic shutdown…for now. On the other hand, if this company’s performance – as a proxy for the outperforming tech sector – cannot carry the day, it can quickly eat away at latent confidence. The other high profile them to precede the Asia session is the news that the US has topped off a critical stimulus program.
Chart of Ratio of Netflix to S&P 500 Overlaid with Ratio of S&P 500 to VEU (Daily)
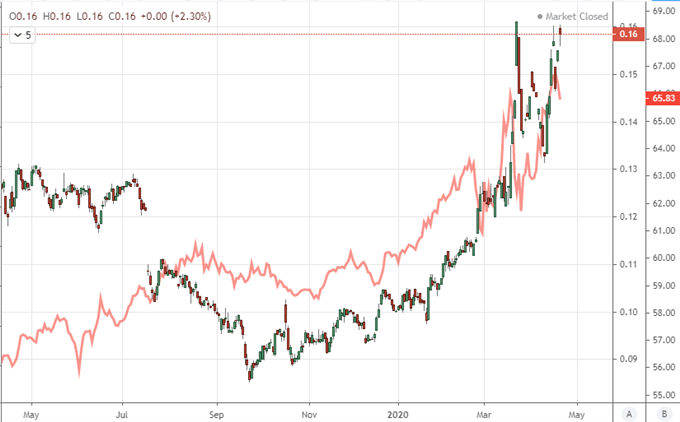
Chart Created on Tradingview Platform
Anticipation for Growth and Cues for Stimulus
If there is a traditional fundamental stepping stone for the markets to advance a bullish rebalance upon heading into Wednesday’s liquidity, I would first start with the implications not in outlier economic hope but rather the temporary salve of stimulus. In the former, case, we had the update from the German and Eurozone investor sentiment figures for April from ZEW. Surprisingly, the survey swing from a deep negative reading (-49.5) to a substantial positive (28.2). I’m dubious of this survey’s reflection of the whole economy – much less the broader system – but a market ready to capitalize on good news frequently alters the values of data. Nevertheless, markets didn’t seem to relieved. In contrast to the ZEW figures, a Reuters US GDP poll lowered growth forecasts for first and second quarter (to -4.8 and -30 percent respectively) which takes one’s breath away. Further, we have the anticipation of April PMIs which are my preferred proxies of timely GDP for key developed world economic health on tap for Thursday.
On the other side of the equation, stimulus may work more aggressively on the speculative appetite in the system heading into Wednesday trade. After the NY close, it was announced that the US has passed an additional $484 billion in stimulus to top off the depleted SBA lending program that was a key part of the massive $2 trillion-plus package issued just a few weeks ago. This supposed Phase 3.5 program is encouraging but it still remains to be seen if it is enough. Meanwhile, the Senate Majority leader has suggested Phase 4 won’t happen until the Senate is fully returned to their chambers and the Treasury Secretary has stated that there would not be another tranche beyond four.
Chart of S&P 500 Overlaid with the Federal Reserve’s Balance Sheet (Weekly)
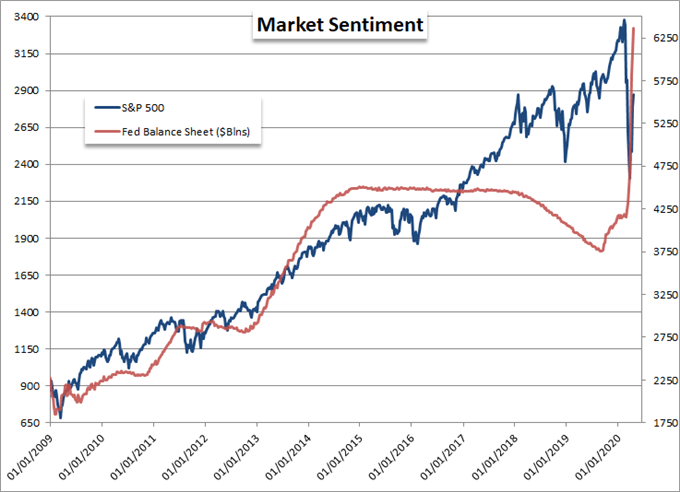
Chart Created by John Kicklighter with Data from Bloomberg
Crude Oil’s Pain Doesn’t Stop with the WTI’s May Contract
My attention in the upcoming session will focus on a few key points. EURUSD will once again be the unlikely focus for a few significant updates. In contrast to the New York open in the aftermath of Netflix and stimulus news, the Euro is facing a key event aimed at keeping pace. The ECB is reportedly due to meet in order to discuss the possibility of lowering credit quality standards for collateral. In other words, it is weighing whether to accept certain ‘junk’ rated assets to further spread its life giving stimulus. This event will not likely move markets unless the speculative rank decide something went ‘very wrong’.
Meanwhile, oil continues to earn our rapt attention. Following Monday’s incredible dive in the US-based WTI active futures contract collapse into negative territory, we saw the crude market roll forward to the June contract. In an ideal (for bulls) world, this would have resolved the liquidity-burdened issues that the May contract succumbed to, but reality was much different. The bearish concern infected the new active nearby at one point as low as $6.50. We could potentially chalk up the Monday crisis in energy markets to liquidity in the rollover, but activity in the liquid front month this past session severely undermines that ‘explanation’. If this pressure persists into Wednesday, we may have a far more serious situation in the crude markets than most had expected as recently as a week ago.
| Change in | Longs | Shorts | OI |
| Daily | 3% | -7% | 1% |
| Weekly | 31% | -38% | 7% |
Chart of Continuous WTI Crude Contract with Volume and Overlaid with the June Contract (Daily)
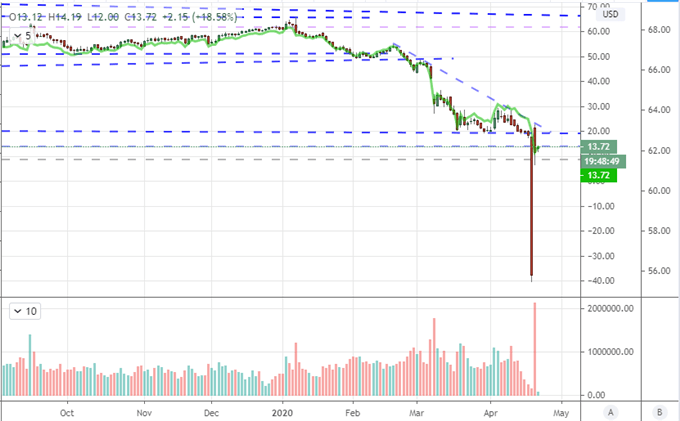
Chart Created on Tradingview Platform

If you want to download my Manic-Crisis calendar, you can find the updated file here.
.


