


Dow and Treasury Talking Points:
- The Dow and S&P 500 gapped lower Wednesday, marking the worst start to a new quarter since the Great Depression – very particular statistic
- Technical levels like congestion and fundamentals like the ISM manufacturing report deferred to liquidity concerns in certain key markets
- Top event risk to finish this week includes US initial jobless claims and NFPs, but I am watching Treasury liquidity and renewed talk of Iran-US conflict
Rough Start to the Quarter Reminds Us of Market Sentiment
With Wednesday’s trade, we were witnessing more than mid-week trade. The session represented the opening period for the month of April and preliminary thrust of the second quarter. In the preceding week, there was a noticeable moderation from the February/March systemic upheaval. Benchmarks like the US equity indices were carving out not just a rebound but consolidation patterns that seemed primed for a subsequent breakout to extend a larger recovery. Yet, market conditions have a way of waylaying expectations set out be traditional fundamentals and technicals. For the Dow – a trendsetter among the global capital markets – the rising wedge/triangle formation may have seemed a textbook prompt for continuation while some key event risk beat troubled forecasts, but index nevertheless resolved with a break lower. The gap down echoed the volatility of previous weeks even though the absolute change didn’t stretch to the same extremes of movement of recent history. For those looking for statistics, the more than 4 percent drop was one of the worst starts to a quarter stretching back decades.
| Change in | Longs | Shorts | OI |
| Daily | -18% | 18% | 7% |
| Weekly | -19% | 14% | 4% |
Chart of Dow with 1-Day Rate of Change and 20-Day ATR (Daily)
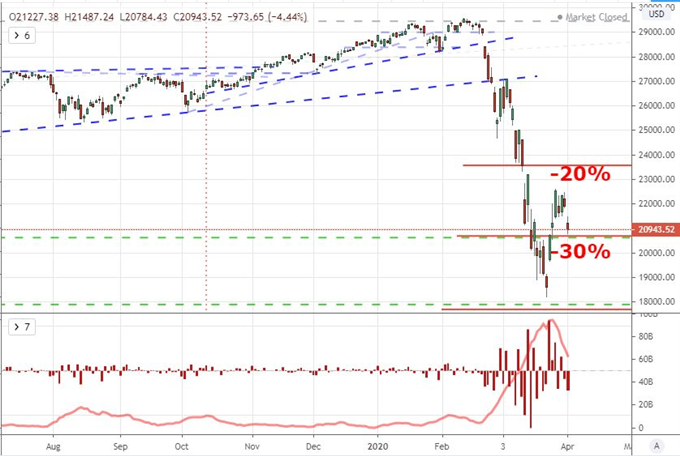
Chart Created on Tradingview Platform
It is somewhat arbitrary in my book to compare this past session’s performance to the start of previous quarters as the time frame does not conform particularly well to the more standard weekly separation of time. On the other hand, there is significant investor capital flow around these longer periodic designations. Large funds often rebalance on the quarter, and first quarter turmoil doesn’t exactly spell enthusiasm for tying up speculative capital for the next three months as a high probability global recession marches into view. On this premise, many risk leaning assets put in for a similar performance from global equities to emerging markets to high yield investments. The question of course is whether these potentially time-limited flows would extend into regular trade through the second half of the week and beyond. The smoldering wreckage of the previous five weeks doesn’t need much prompting nor does the recognition of fundamental pain ahead.
Chart of Relative Performance in ‘Risk-Leaning’ Assets
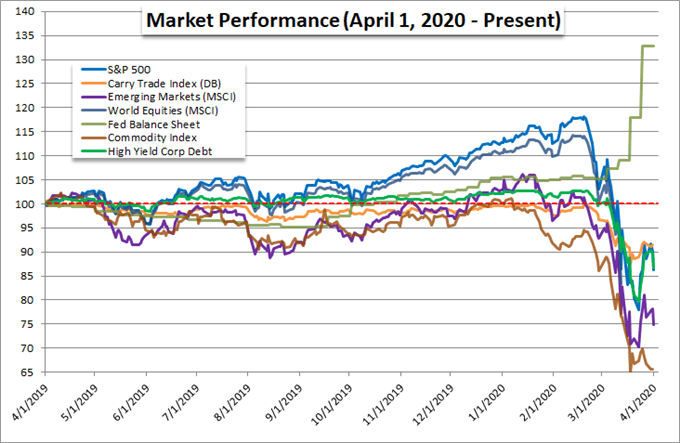
Chart Created by John Kicklighter with Data from Bloomberg
Event Risk Defers to Bigger Questions of Geopolitical Risk and Liquidity
It would be easy to attribute this past session’s swoon to a simple reaction to event risk and be down with it. That would be ‘comforting’ for those looking for explanation with an underlying bullish agenda because it could suggest that the next favorable update could right the ship. Wednesday’s run held a wave of manufacturing updates for the globe with the United States issuing the March ISM report. The data point slipped back into contractionary territory (below 50) with the new orders component registering its worst showing in 11 years. Then again, a slump was expected and the headline figure wasn’t as painful as expected. Ultimately, the service sector counterpart due Friday from the US is more indicative of growth, the employment data over the next 48 hours (weekly jobless claims today and NFPs Friday) are more loaded and it is common expectation that the recession will set in through data over the coming weeks. Seeing such response to predictable data against a backdrop of efforts to massive stimulus programs – the US is supposedly working on a Phase 4 infrastructure program – is a reminder of systemic trouble ahead.
Chart of S&P 500 with US ISM Manufacturing and Service Sector Surveys (Monthly)
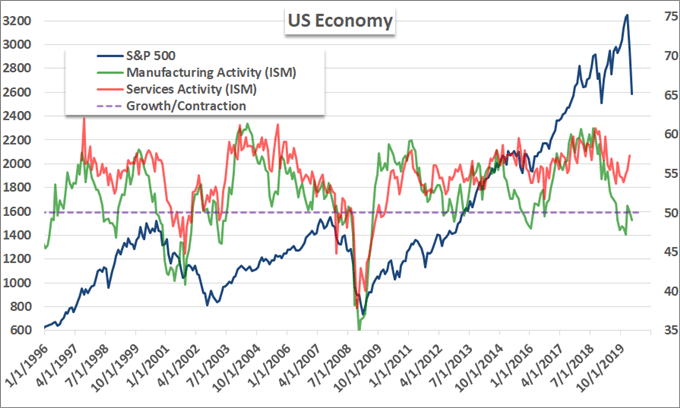
Chart Created by John Kicklighter with Data from ISM and Bloomberg
The setting in of a global recession is a troubling fundamental path that will no doubt tax market sentiment. However, this behemoth of a motivation will develop more or less with high visibility and some significant level of forewarning. There is another course of upheaval that could disrupt a troubled return to speculative norms in the form of dislocations such as through liquidity channels. Following reports from the US National Security Advisor that the country would work with other large energy producing countries to curb volatility in oil prices, US President Donald Trump tweeted an unsettling statement that Iran may be looking to attack US assets in Iraq. Geopolitical triggers in this environment could prove potent. Meanwhile, the Federal Reserve acted again to steady the financial system announcing easing of capital requirements for large banks while also allowing transfer of foreign Treasury holds to Dollars, moves aimed at easing the pressure on the systemically-important US sovereign debt market (the face of risk-free benchmark). Will it hold?
Chart of US 10-Year Treasury Yield Overlaid with St Louis Fed Financial Stress Index (Monthly)
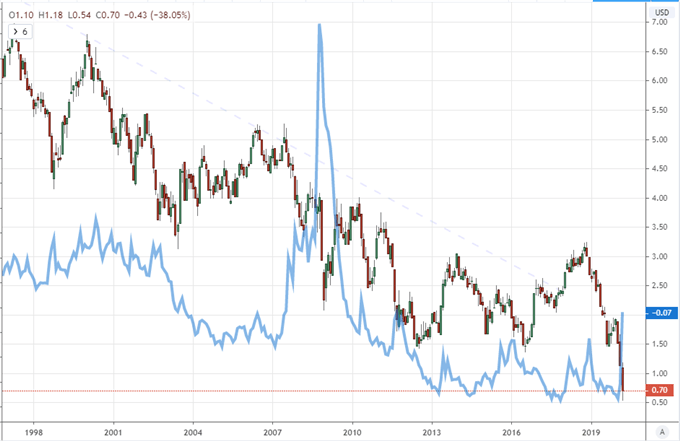
Chart Created on Tradingview Platform

If you want to download my Manic-Crisis calendar, you can find the updated file here.
.


