Dow and Oil Talking Points:
- The quarter closed Tuesday with the worst performance for the Dow over that period since 1987 while oil set a record
- US sentiment and Chinese PMIs data was reminder of the recession risk ahead with US manufacturing and NFPs high profile events ahead
- Adding to its way of stimulus, the Fed announced a new global repo facility for Dollar while the US President weighed back into infrastructure spending
A Steadying to the Worst Quarter in Decades
Tuesday brought to a close a quarter many investors and traders will be eager to forget. While the day ended up a retreat in most risk assets that were active through the New York session, it wasn’t enough to forge new lows for the week – much less revive the panic of previous weeks in March. While most market participants with an investment in the long-only view of the financial system are unhappy with any decline, this past session’s performance added marginally to my slowly forming relief. While the Dow and S&P 500 would slip through Day’s end – not exactly surprising with quarter end rebalancing – the move fit neatly within the past week’s consolidation pattern. A wedge pattern for the likes of the US indices is a welcome return to normalcy after the weeks of abject collapse for risk leaning measures. Looking ahead to the next trading session, we enter 2Q with few commitments on risk taking. The response to key event risk and the sensitivity to the systemic should be watched closely. Yet, for now, some normalcy.
| Change in | Longs | Shorts | OI |
| Daily | -18% | 18% | 7% |
| Weekly | -19% | 14% | 4% |
Chart of Dow with Volume and Rate of Change (Quarterly)
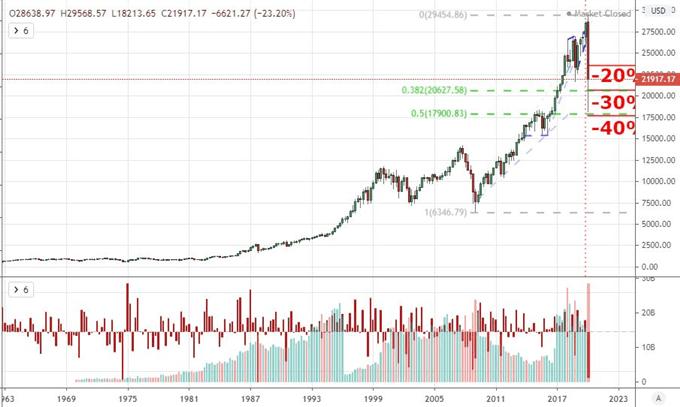
Chart Created on Tradingview Platform
While the day and week are a study in moderation, the big picture of the three-month quarter to open 2020 is anything but reassuring. The first quarter of the year is among the worst we have seen in some time. You will find many statistics relating the worst ‘first quarter’ on record for the likes of the Dow and S&P 500. That specification is made as the opening thrust of a year is often associated to some degree of enthusiasm. However, I don’t find much value in this designation. Overall, the blue-chip US index posted its worst absolute quarter since the final stretch of 1987 (the period encompassing the crash of the period). That is itself disturbing enough. This leaves me with as much unease as enthusiasm for lies ahead. Fear is easy to trigger with a high-probability recession ahead. Can sentiment hold up its standard level of complacency from the past decade with such a transparent view ahead?
| Change in | Longs | Shorts | OI |
| Daily | 3% | -7% | 1% |
| Weekly | 31% | -38% | 7% |
Chart of US Crude Oil with Volume and Rate of Change (Quarterly)
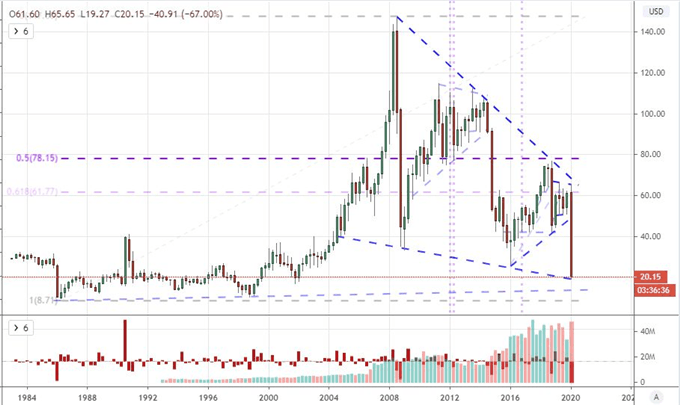
Chart Created on Tradingview Platform
The US Attempts to Raise the Bar to Fend Off the Cold of Recession
As far are the balance of stimulus goes, effectiveness seems to fall back on the balance between recessionary signals against the response in stimulus. The former will be a constant escalation over the coming weeks as the full-impact of the economic slowdown will no be known for some time. Alternative, the response by policymakers is a function of how much they believe is needed relative to what they can encourage among their respective leadership. In that global picture, the subsequent iterations have been relatively slow in coming, but the US seems to be making an admirable effort to play catchup. This past session, the Federal Reserve announced that they were introducing a global swap initiative that would allow foreign banks use treasury holdings as collateral for dollars. This is an important move for ensuring liquidity globally.
Chart of Google Trends in ‘Recession’ and ‘Stimulus’
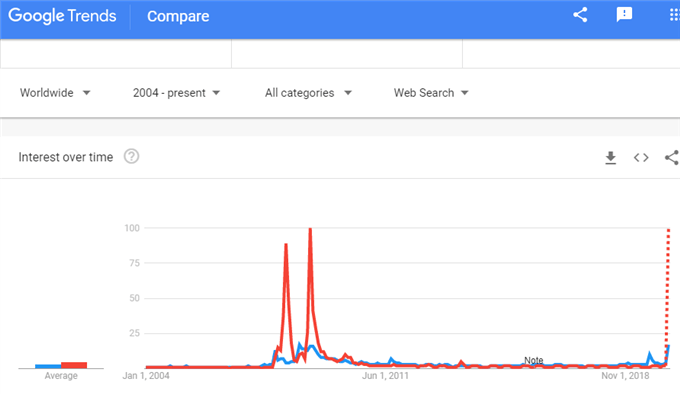
Chart from Google Trends
The central bank isn’t the only US institution making moves. The White House unexpectedly issued a signal of proactive progress. With the massive $2.2 trillion stimulus program only passing the Resolute Desk this past Friday, we read President Donald Trump tweet a support for follow up on the long-vaunted infrastructure stimulus program. According to the President, he was looking for a ‘Phase 4’ program that would rival the pandemic program as he felt it time for a ‘VERY BIG & BOLD’ effort that took advantage of zero interest rates. There are a host of questions that come behind this aim: whether or not it is even passable; whether it could be used during the economic shutdown or after; and whether this additional move is ultimately enough. Nevertheless, it is significant commitment that may ultimately swamp a deep recession.
Chart of S&P 500 and Fed Balance Sheet (Weekly)
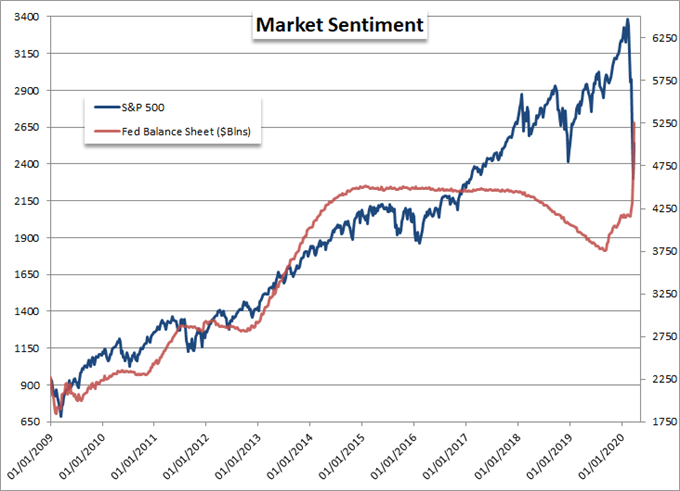
Chart Created by John Kicklighter with Data from Bloomberg


Fresh Economic Reminders of the Winter Ahead
An overwhelming stimulus is going to be important to padding sentiment considering there is a history-defining recession coming. This past there were a few high-profile indicators worth marking. The Conference Board’s US consumer sentiment survey was a sharp drop to 120, but it was still significantly better than the 110 projected. A note from those conducting that they expected significantly worse ahead and there were signs pointing to a protracted scenario rather than an abrupt one-off should prevent us from seeking unlikely solace. The Chinese PMIs were another point of contention. Here, a reversal from February’s 28.9 (anything below 50.0 is a contraction) to the recent reading of 53.0 raises some serious questions – at least in my mind. There is evidence that China is restarting its economy, but this level of reversal seems to good to be true.
Chart of USDCNH Overlaid with USDAUD in Blue (Weekly)
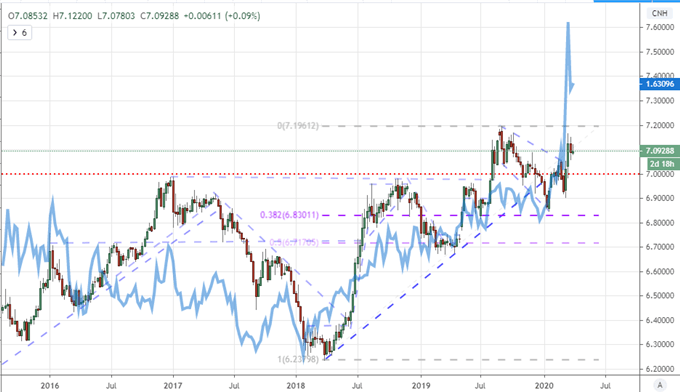
Chart Created on Tradingview Platform
Ahead, the data will be both global and fundamentally attuned to the course for growth. Asia has the 1Q Japanese capital expenditures figure. Europe will host a working group preparation for next week’s Eurogroup gathering as well as the ECB’s non-monetary policy meeting. In the US, a run of data is topped by the ISM manufacturing activity report. With a longer historical run than Markit and longer survey time, this may present a more substantial economic compass reading for the world’s largest economy. That said, I will be reserving some of my attention for Thursday’s service sector report and Friday’s NFPs (and broader labor update).
Ratio of US Crude Oil to Dow (Monthly)
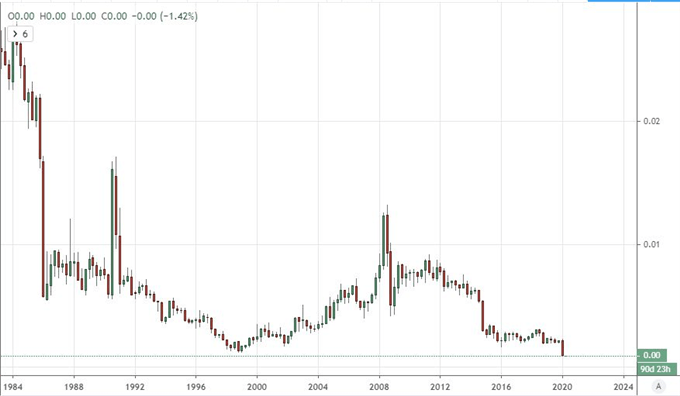
Chart Created on Tradingview Platform
If you want to download my Manic-Crisis calendar, you can find the updated file here.
.


