


S&P 500, Dow, EURUSD Talking Points:
- A broad and more intense - than anything we had seen in two months - risk aversion Friday was led by the bulls' champions: SPX and Dow
- Key technical boundaries remain for prevailing bullish trends, market participants will be on guard for any high-profile breakdowns
- Growth will be a top theme next week - though PMIs didn't fit Friday's climb - the Fed decision and coronavirus spread are additional risks
Market Risk Watchers Stirred from Slumber to End the Week
Though market participants may harbor some concerns about the state of the market and economic backdrop, it can easy for them overlook the implications so long as the markets continue to hold a steady, bullish course. There are few more prominent visual examples of this complacency-led enthusiasm than the major US indices which have maintained an incredibly consistent – slow but steady – rising trend channel since early October. In fact, conditions have been so reserved over that time that we haven’t even experienced a one percent or greater move from the benchmark S&P 500 in 72 trading days (through Friday). There were two longer bouts of extreme inactivity back in 2018, but such an event is rare enough that we have to look back decades to get a third comparable scenario. This can be a sign of comfortable conviction or abject complacency depending on the intentions of the market forging the move. I believe it fits more squarely into the latter category, but the adage ‘the market can remain irrational longer than you remain solvent’ applies to pushing one’s own assessment of what value ‘should be’.
Chart of S&P 500 with Consecutive Periods Without a 1 Percent Move (Daily)
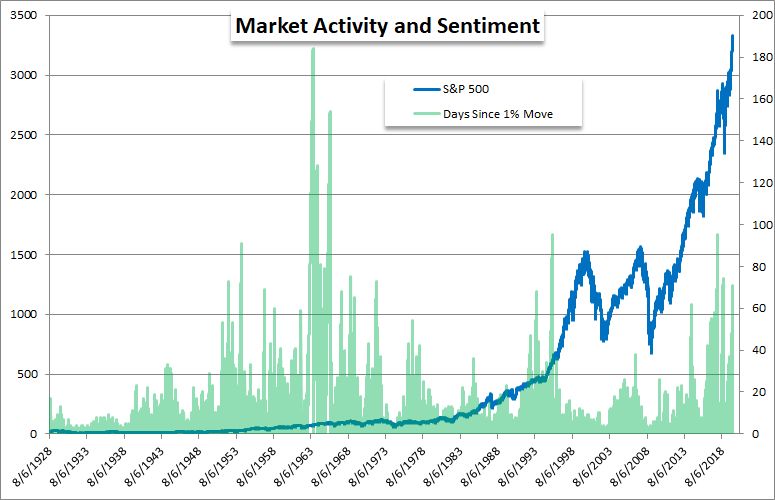
Chart made by John Kicklighter with data from Bloomberg Platform
Activity levels in the market are naturally ‘mean reverting’. While it is possible to experience extended periods of quiet or heightened volatility, conditions will eventually normalize according to the structure of the underlying market. The past three-month charge for US indices is exceptionally restrained and will eventually end with a jolt of activity. While always possible to have this result in a bullish charge, that is likely difficult to achieve in restrained liquidity conditions and against the current backdrop of speculative excess. For that reason, I will be watching through the channel floors for the S&P 500 and Dow through the opening 48 hours of the new trading week. Monday is notably light for scheduled event risk, so a break in momentum is possible; but it is better to stay vigilant rather than fall back on any presumptions – whether pro or anti-volatility.

Chart of S&P 500 CFD and 50-Day Moving Average (Daily)
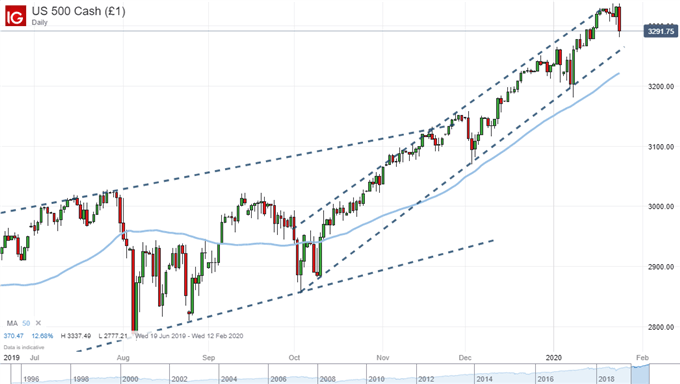
Chart Created with IG Trading Platform
The Potential for a Fundamental-Led (Growth) Versus Headline-Led (Coronavirus) Market
Where there was a broad swoon in risk trends through Friday’s close, it was hard to peg the move to a particular fundamental motivator. Growth could have taken the reigns as there was a run of January PMIs that spanned the world – at least some of the largest developed economies – and the comprehensive proxy for global GDP has pulled the reins in the past. However, when we look at the actual outcome of the mix; the overview was one of improvement or at least relief from previous months’ strain. While the Australia activity readings slid further into contractionary territory (below 50), the Japanese and UK composites rose back above 50 while the UK’s manufacturing report registered a strong recovery from 47.5 to 49.8 (services and composite are well over 50) and the US service segment ticked up to 53.2 to offset the 0.7 point slip in manufacturing to 51.7 (still above 50). That said, the US 10-year to 2-year yield spread – a measure of growth forecast for some investors – did slip through Friday as well.
In the week ahead, we will have another run at growth as a spark. If sentiment remains lodged in temperate risk aversion, we may yet again seen favorable updates instantly discounted while troubled data may act to justify the emergent worry. While there are some interesting economic-related figures such as US earnings and the Chinese government’s PMIs, my attention is trained on the US and European 4Q GDP readings. I will also keep tabs on the Mexican growth reading for the same period given its technical shift these past weeks.
Chart of US 10-Year to 2-Year Yield Curve with 100-Day Moving Average (Daily)
Chart Created with TradingView
A tangible fundamental theme to follow can be convenient. When we are able to identify a lever that holds greater influence over the market than anything else, it can be easier to identify event risk that has reasonable chance of restoring momentum by tapping into that particular current. However, Friday’s divergence from the docket may indicate that a more abstract and unscheduled matter may command our collective attention. Fear over the health risk of the spreading coronavirus is easily understood when you consider the coverage in the news headlines – though the direct economic and financial implications are nebulous. What speculation can build up, it can also tear down.
Google New Search Ranking Globally for ‘Virus’ and ‘Flu’
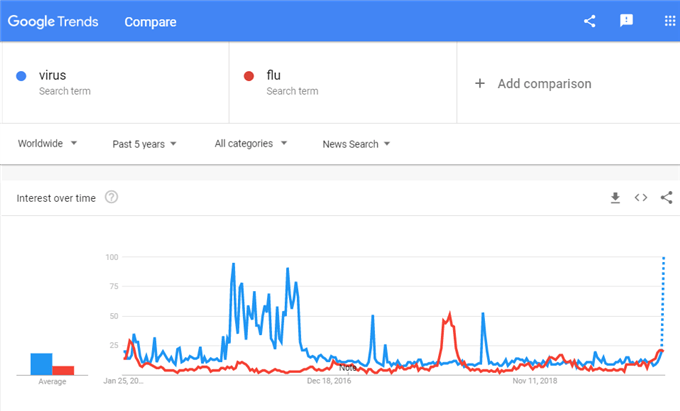
Graph from Google Trends Console
Across a Sea of High-Profile Event Risk, A Potent Mix for More EURUSD Volatility
Looking at the global economic docket for the week ahead, there are quiet a few higher profile indicators on tap which could each stir volatility for their own currency or local capital market if the right chord is struck. However, there seems particular potential for the benchmark EURUSD. The Euro’s docket is no slouch with sentiment surveys in the first half of the week and 4Q GDP readings from the Eurozone, France and Italy through the end. That should draw attention with the Euro sliding to a new two-and-a-half year low on an equally-weighted basis this past week. Yet, I am directing more of my attention to the Dollar which will supplement a consumer confidence report that will weigh in on election-related concerns and the United States’ own 4Q growth report with the FOMC rate decision.
Chart of Equally-Weighted Euro Index with 50-Day Moving Average (Daily)
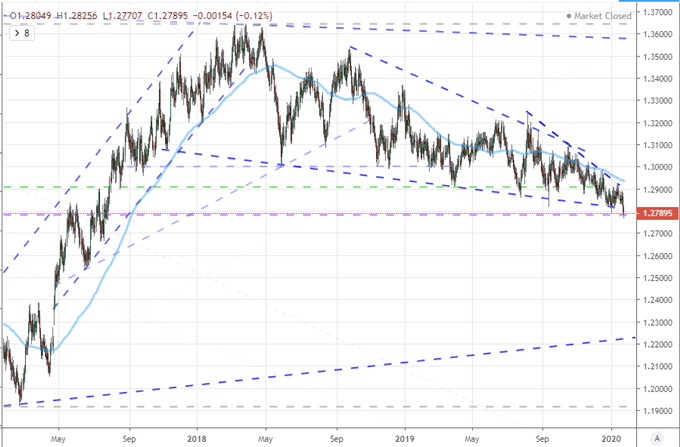
Chart Created with TradingView
If you are an FX traders – or to a certain extent in any market with global sensitivity – it is important to watch this most liquid exchange rate. There is enormous volume behind EURUSD according to the Bank for International Settlement’s Triennial and the IMF’s COFER reports. Just as government bond yields can set the baseline for rates of return across a financial market, the most heavily used exchange that hold significant sway over the turnover seen in other areas of the financial system. That said, where the pair’s break this past week was generally a ‘path of least resistance’ as it moves back into a well-established range, it does so with a greater degree of interest behind it. Should this activity carry over, it could carry significance for more than just the particular exchange rate or even FX itself.
Chart of EURUSD with 100-Day Moving Average (Daily)
Chart Created with IG Trading Platform
If you want to download my Manic-Crisis calendar, you can find the updated file here.
.


