Risk Aversion Talking Points:
- Risk trends opened to another steep tumble with the S&P 500 leading with its biggest bearish gap in months
- Trade war headlines was top concern once again as Trump suggested a China deal could wait for the election and tensions with Europe rose
- Growth concerns are drawing market attention with the recently-popular US 10yr3mth yield spread dropping and US services report due
What do the DailyFX Analysts expect from the Dollar, Euro, Equities, Oil and more through the 4Q 2019? Download forecasts for these assets and more with technical and fundamental insight from the DailyFX Trading Guides page.
Markets Disengage from Fear but There Is Still Far More Bearish Potential
Traders have been on high alert this week as the return of liquidity following last week's holiday liquidity drain (a US event that carries global response) has ushered in a steep tumble in risk-leaning assets. In the one-two hit between the Tuesday break and Wednesday gap lower for US indices, it seemed that naked fear was showing through and utter capitulation could follow with little further provocation. Yet, that technical correction didn't seem to cross the threshold of self-sustaining momentum as there was a broad bounce in risk assets just this past session. From the S&P 500, the resultant back-to-back gaps (in opposite directions) would render a technical pattern that is usually associated with a strong bullish reversal intent. A similar turn was marked in the range of 'risk assets' that I usually follow for an overview, but the reversal was far less impressive staving off a signal much further from a true breakdown.
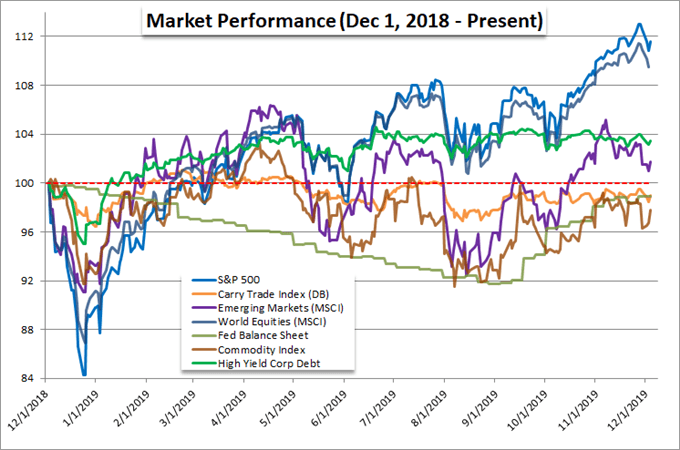
If you need any evidence that it is worthy being cautious in chasing a chart-based speculative charge for the bulls, just consider the lack of traction the bears mustered with a more prominent breakdown just the preceding 48 hours. After weeks of consistent and progressive climb for a benchmark like the S&P 500 - building remarkable premium along the way to record highs - the break of such a well-defined channel and subsequent gap lower could have easily tipped sentiment into a vicious cycle of fear. And yet, that didn't happen. The critical factor here is underlying market conditions in participation of volume. There is incredible reticence to see a wholesale deleveraging into the end of the year that could create disorderly environment that could prompt a true financial crisis (consider the short-term funding problems the Fed is having). On the other hand, building serious traction into a further leg higher in risk exposure runs up against a growing recognition of diminished value. If anything given the nature of volume and volatility, a climb may be a higher probability, but declines are more likely to spur deeper conviction.
Chart of S&P 500 and Inverted VIX Index (Daily)
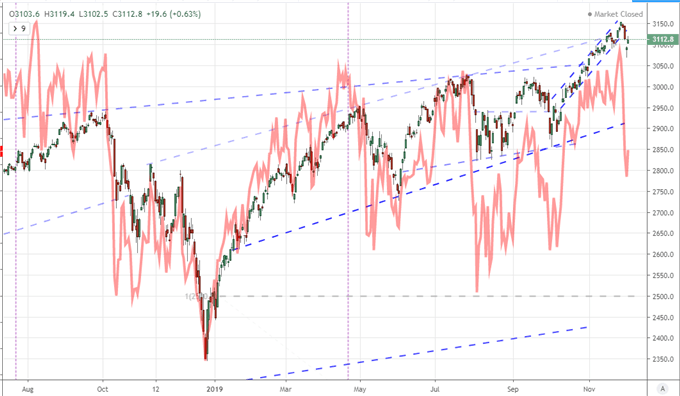
Chart Created with TradingView Platform
US Services PMI the Highlight of Growth Data, Hits Dollar More than Global Risk Trends
Looking to the fundamental cues that have guided markets this year, it was clear that they all relinquished their principal influence over the financial system this past session. The most data-centric theme Wednesday was the health of economic activity - more to targeted regions than a perspective of the globe. The Australian 3Q GDP release was the most direct update but its inline 1.7 percent year-over-year pace would offer a relative reserved response for the Aussie Dollar. More interesting was the Chinese Caixin service and composite PMI. China says its service sector is approximately half of output - I find that dubious - but the better than expected reading of 53.5 (versus 51.2 expected) was a point of optimism for a struggling economy and key trade war participant. That mix would certainly cause some confusion for AUDUSD.
Chart of AUDUSD with 200-Day Moving Average (Daily)
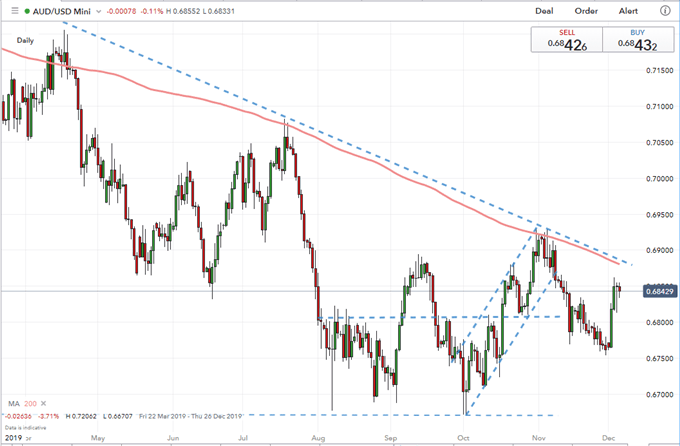
Chart Created with IG Charts
| Change in | Longs | Shorts | OI |
| Daily | 2% | 3% | 2% |
| Weekly | 29% | -46% | 0% |
The top growth reading in my book was the ISM-measured service sector (non-manufacturing) activity survey. This is a longer running measure of the biggest business sector in the world's largest economy. In essence, if there is a torch bearer for global growth, this would be it. Recently, the Markit service sector PMI offered some measure of relief with a notable contrast to the rest of world figures for the past month - a disparity that earned the Dollar its last run. Yet, the ISM's figure disappointed with a slide to 53.9, falling short of the 54.5 downstep. That is still far from the 50 mark that represents the tipping point from growth to contraction, but the general course is not encouraging. This didn't sway risk trends, but it seems to have carried weight with the Greenback. The DXY Dollar Index dropped for a fourth consecutive session through Wednesday. We have seen a few five-day slides over the past year - which would push it to the boundary of its 19-month rising trend channel - but the last six-day drop hasn't been seen since the beginning of May 2016.
Chart of DXY Dollar Index with Consecutive Day Runs (Daily)
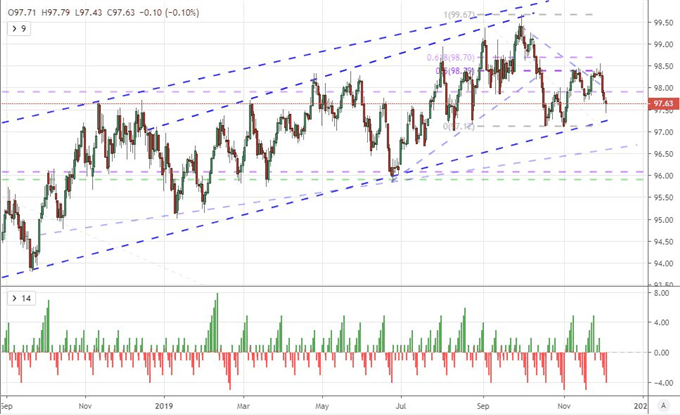
Chart Created with TradingView Platform
As for monetary policy, my principal concern remains the absolute dependency risk appetite has placed upon extreme accommodation to compensate for the lack of traditional growth and yield. Should that faith crumble, the financial market repercussions would be dire. That said, it doesn't seem that we are facing that reality just yet - nor does it seem to be imminent. For this theme, the market movement was isolated to the only top level central bank rate decision. The Bank of Canada didn't change its benchmark rate from the 1.75 percent plateau, but its outlook seemed to head off expectation of any near-term cuts. That led to a significant rally for the Canadian currency. Most impressive was USDCAD which leveraged the fundamental impact with the technical appeal of an established range and market conditions more attuned to short-lived moves.
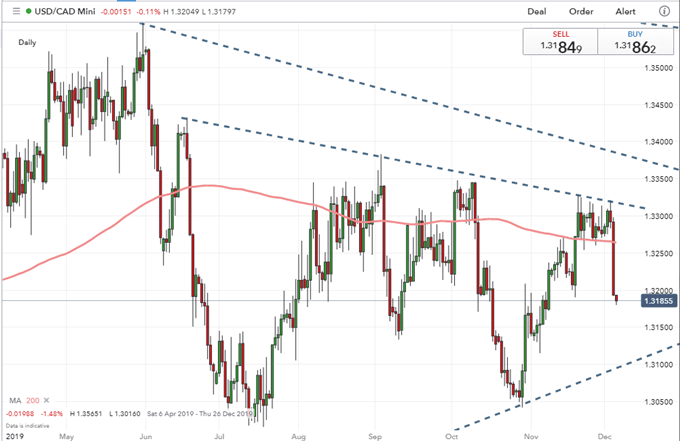
Chart Created with IG Charts
An Effort to Balance Trade Pressure Against Market Performance Increasingly Transparent in Trade Wars
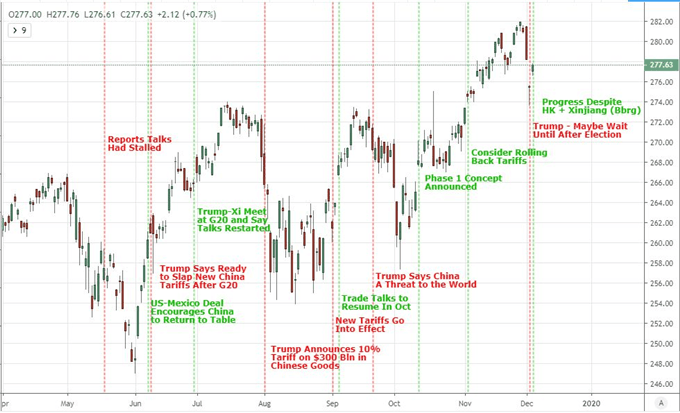
The conducting of trade wars have proven the most market-moving theme of the week thus far. Reports that US-Chinese negotiations were facing new difficulties were seriously amplified for negative market impact when US President Trump himself opined that perhaps it was better for the US to wait until after the November 2020 presidential election, a signal to his trade counterparts that the United States was willing to bear their threats. Yet, the reversal this past session showed that the traction at least slipped if not fully reversed. The headline linked back to a Bloomberg report suggesting the US and China were nearing an agreement on the contentious tariff roll back for a targeted resolution before the December 15th tariff escalation kicks in. That is very presumptuous, and history has shown us that rhetoric seems to shift when the benefit from pressuring trade counterparts is overtaken by the risk to the capital markets. When will the market's stop following rhetoric and instead follow tangible action?
There is little dispute that the US-China stand off is the most onerous global fight currently underway. However, I still contend that the risk of a US-Europe breakout is far more troubling for the financial system. That said, the threat by the US Trade Representative's office to consider further escalation of tariffs against European exporters in response to the WTO's ruling that subsidies to Airbus have not fully stopped is a lingering concern. Further, the retaliation by the United States to the French digital task, keeps open a serious escalation path with the latter country vowing to act. The Trump administration doesn't need an auto tariff to put the pressure on Europe if it is already pursuing sanctioned or 'moral' retaliation to Airbus and digital tax efforts.
If you want to download my Manic-Crisis calendar, you can find the updated file here.
What fundamental themes should you follow next week? How will they impact the markets at large? Sign up for our webinars to better evaluate how market developments are shaping markets. Sign up on the Webinar Calendar.
.


