


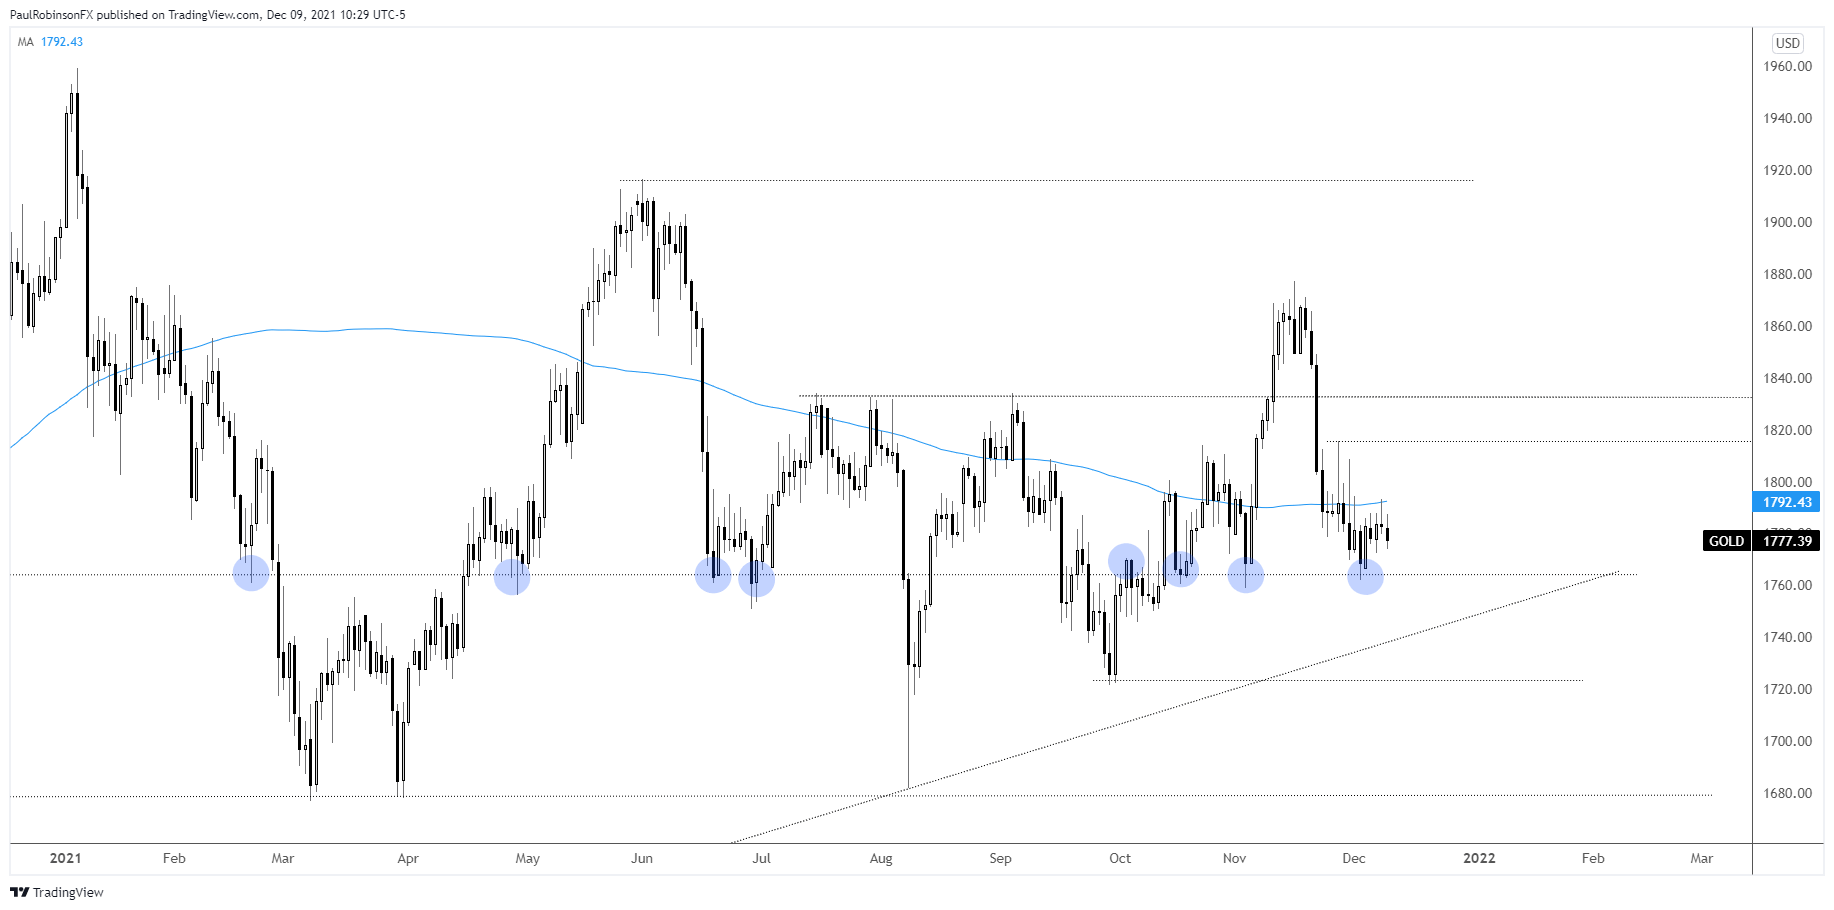
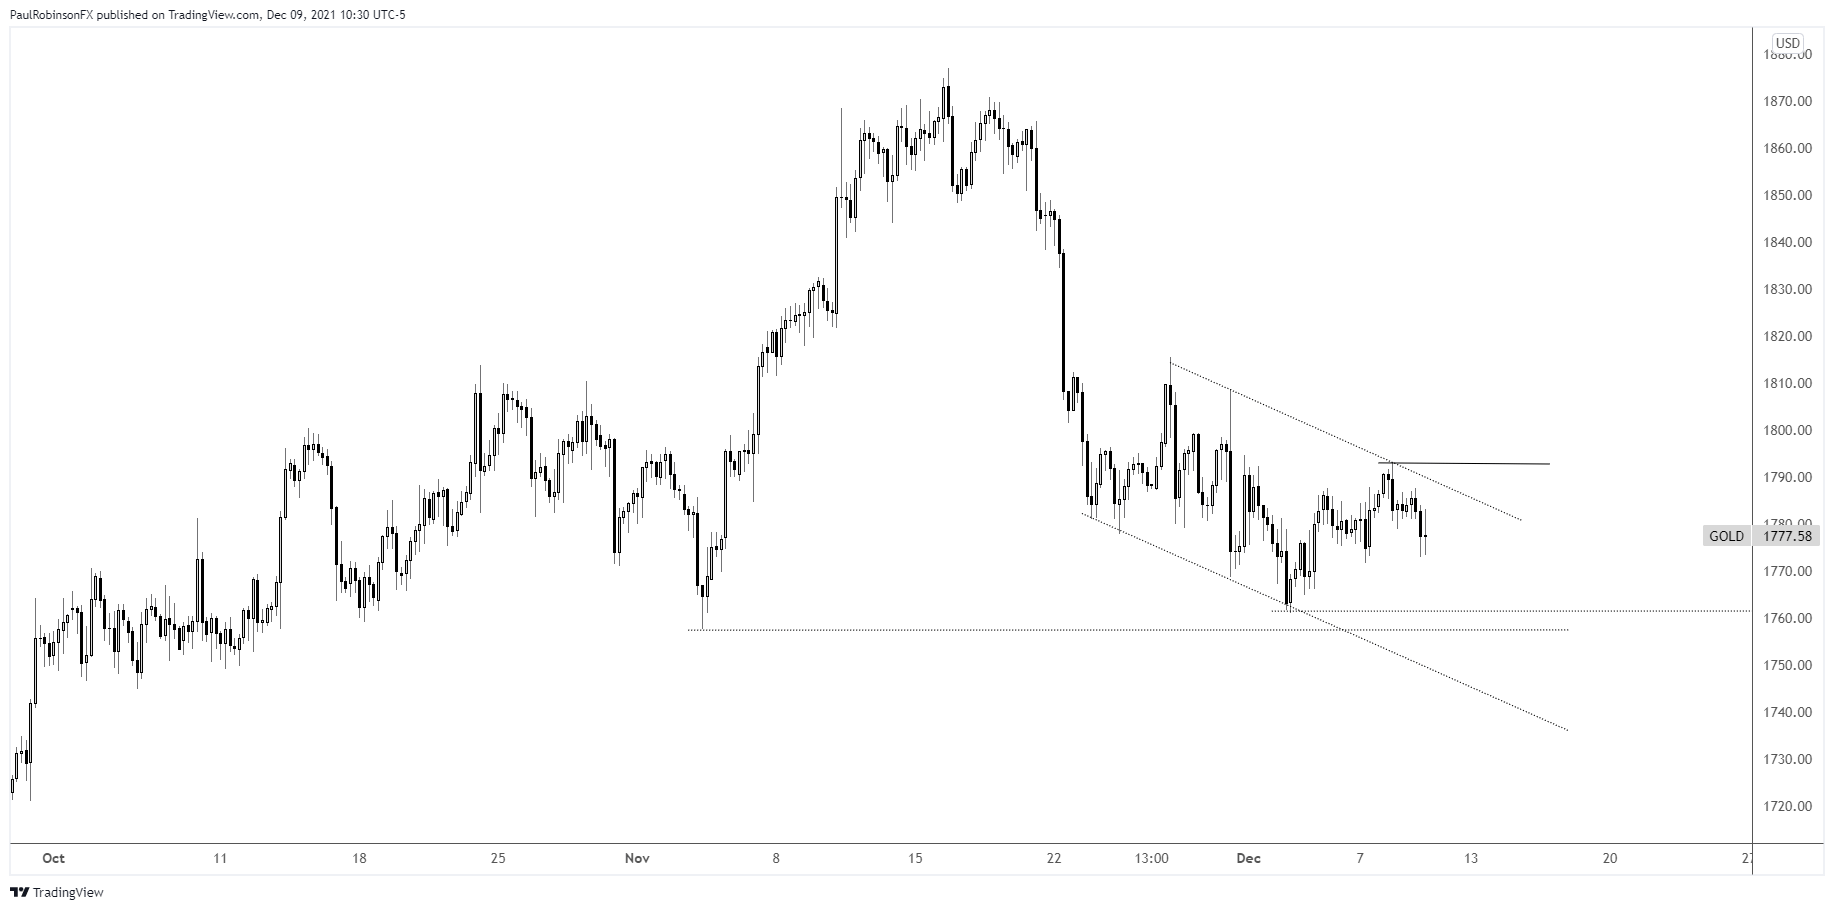
Today, I looked at gold on the monthly, daily, and 4-hr chart, and they all suggest we could see weakness in the days and perhaps weeks ahead. The monthly candle in November points to downward pressure more broadly speaking, while the daily rejection at the 200-day moving average and sideways price action suggest the 1760 area may fail soon. The 4-hr channel helps keep traders guided in the short-term.
For the full view of all charts and detailed commentary, please check out the video above.

Gold Daily Chart
Gold 4-hr Chart
Resources for Forex Traders
Whether you are a new or experienced trader, we have several resources available to help you; indicator for tracking trader sentiment, quarterly trading forecasts, analytical and educational webinars held daily, trading guides to help you improve trading performance, and one specifically for those who are new to forex.
---Written by Paul Robinson, Market Analyst
You can follow Paul on Twitter at @PaulRobinsonFX


