


Gold/Silver Technical Outlook:
- Gold extended but still has room to run before resistance is met
- Silver triggered inverse head-and-shoulders pattern, 200-day in the way

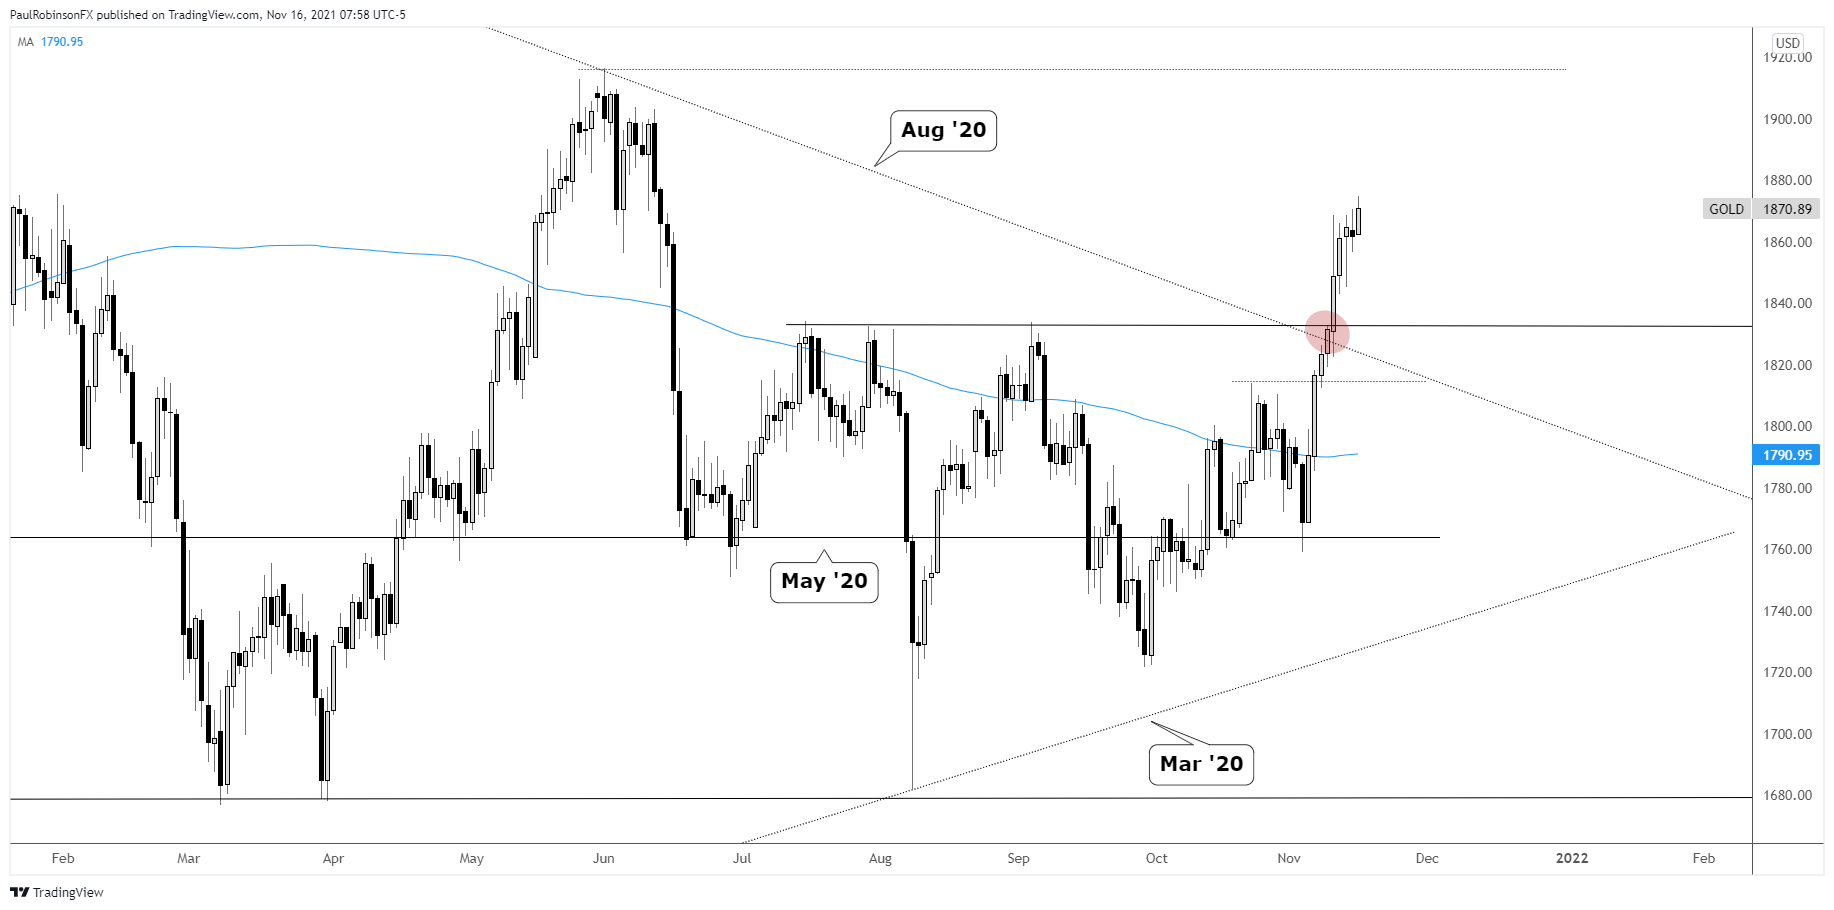
Gold is at its highest levels in four months after breaking out above a key confluence of resistance via a trend-line from August 2020 and several peaks created during the summer. The forceful breakout last week could have the mid-year highs in focus.
The path could be relatively straightforward even though gold may appear somewhat extended in the near-term. If the breakout is indeed for real, and at this point in time there is no reason not to think this is the case, then there may be a bump or two, but otherwise it could be a mostly straight up move.
If this is the case, then the resistance from June may be the next level that causes any real reaction to occur against the recent trend. The high from June is 1916. A pullback or consolidation period in the near-term could offer traders an opportunity to join the trend higher.

Gold Daily Chart
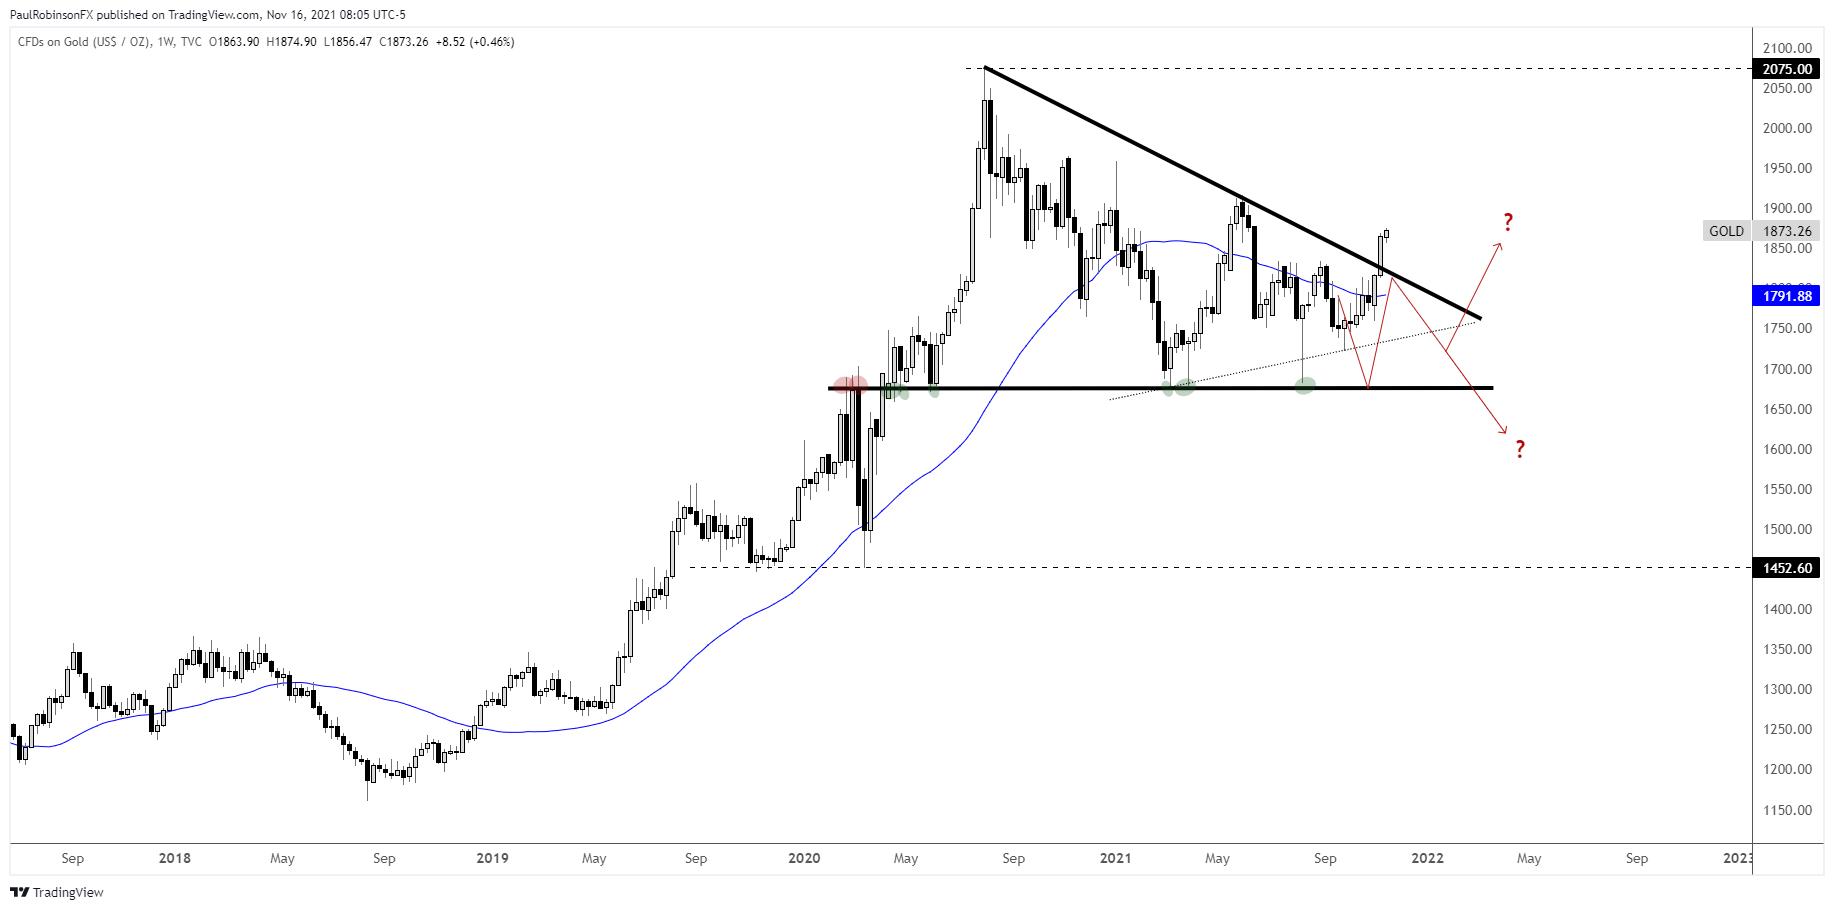
Gold Weekly Chart
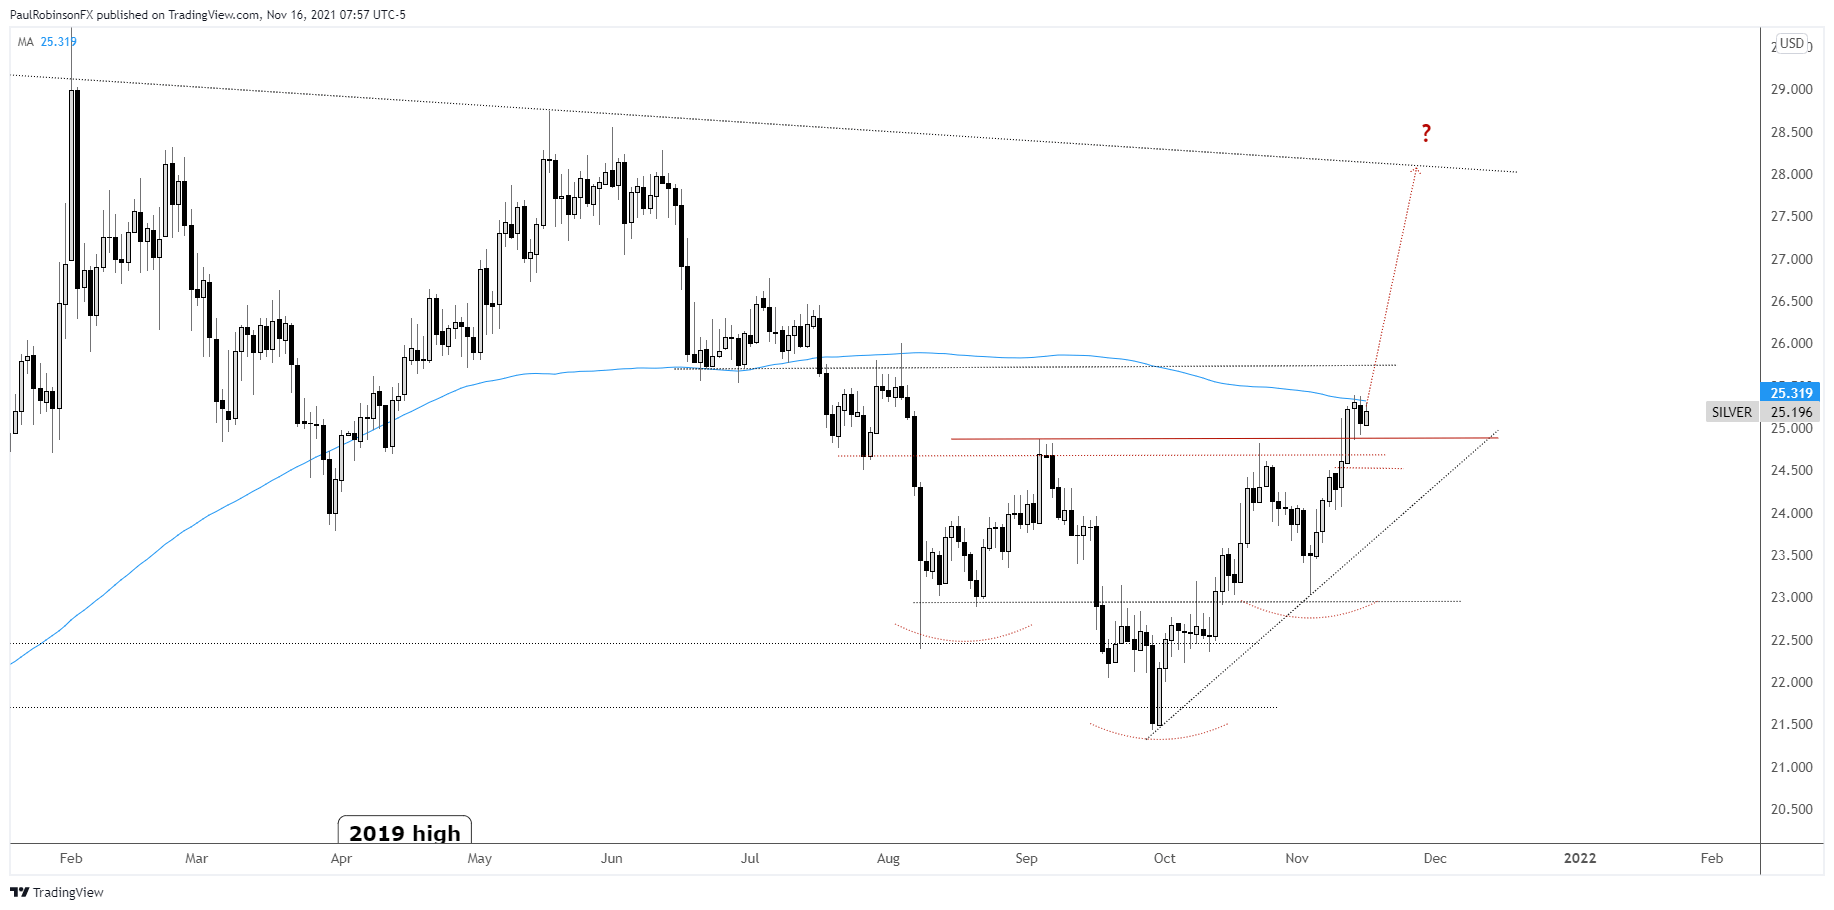
Silver broke out of an inverse head-and-shoulders pattern last week, which suggests it could rally significantly over the coming weeks. But before it can get into further gear it needs to overcome the 200-day moving average it is currently struggling at.
Should we see clearance above the 200 here shortly, then look for continues strength towards the 28-30 area. If we see the neckline get breached, then the patterns bullish outlook isn’t fully diminished but will be somewhat undermined. Caution from the long-side would be warranted.
Silver Daily Chart
Resources for Forex Traders
Whether you are a new or experienced trader, we have several resources available to help you; indicator for tracking trader sentiment, quarterly trading forecasts, analytical and educational webinars held daily, trading guides to help you improve trading performance, and one specifically for those who are new to forex.
---Written by Paul Robinson, Market Analyst
You can follow Paul on Twitter at @PaulRobinsonFX


