


Gold/Silver Technical Outlook:
- Gold is trading around an important area on the daily and 4-hr chart
- Silver remains confined within a channel, renewed weakness anticipated

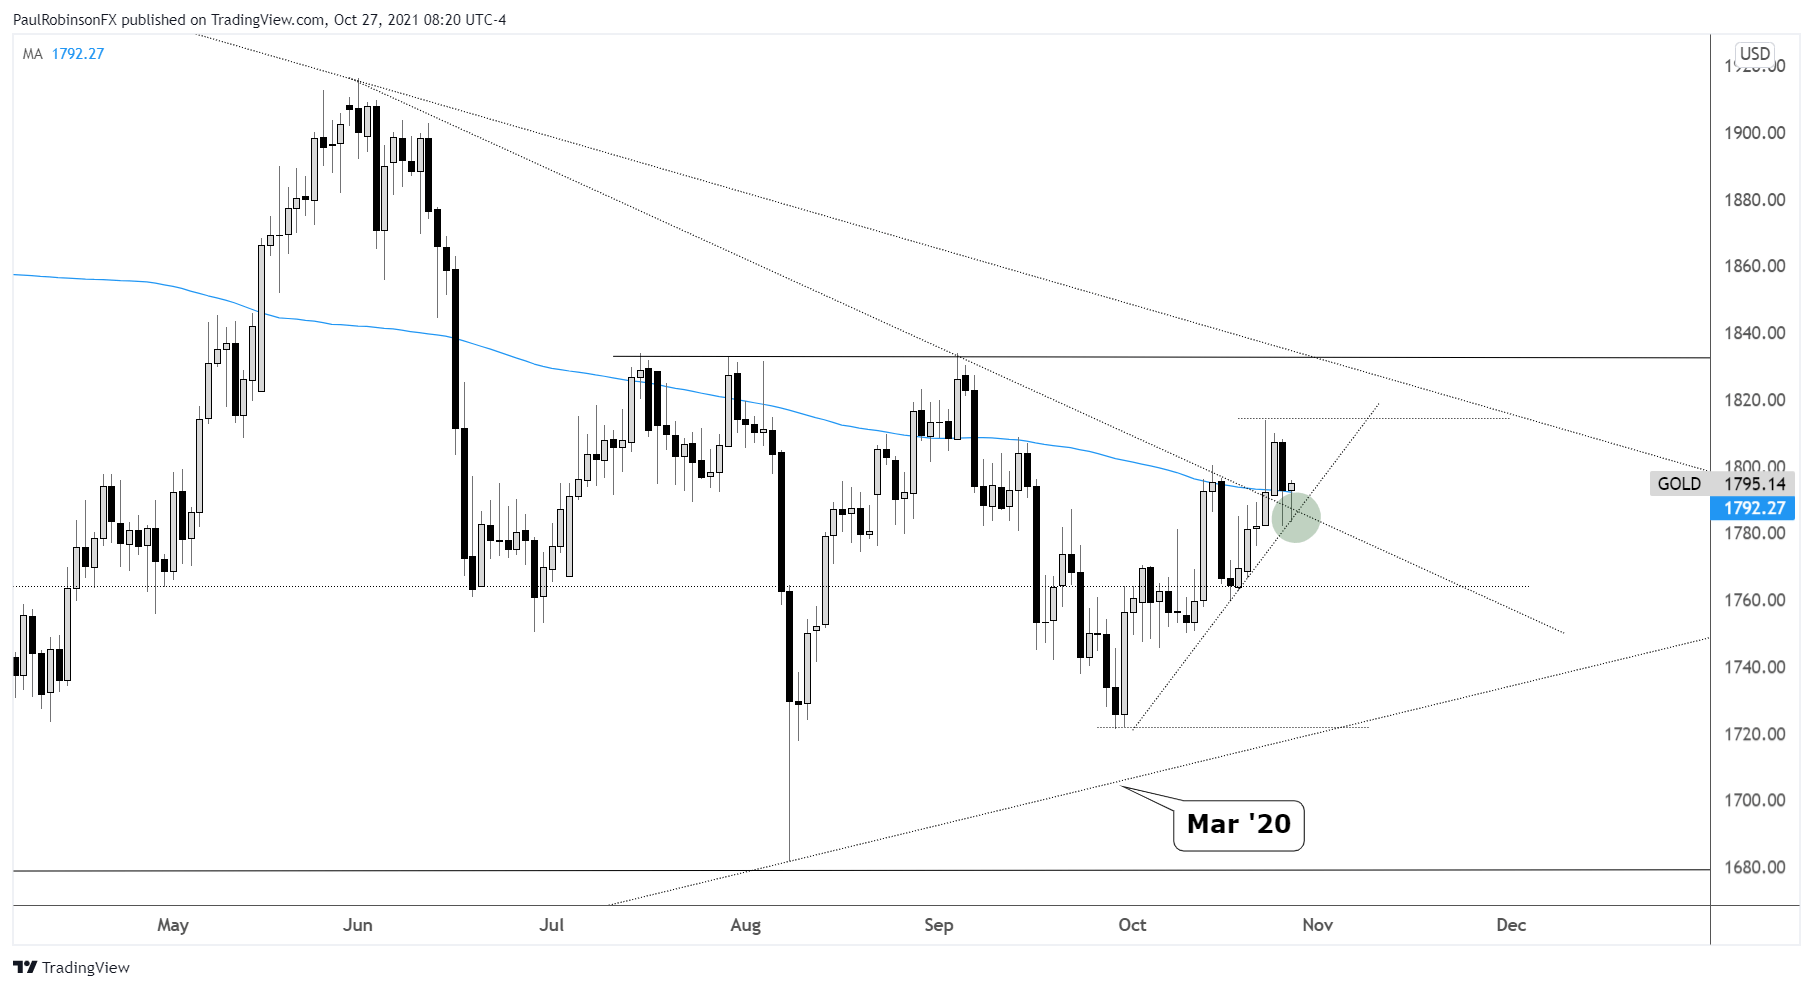
Gold recently broke above the 200-day moving average and June trend-line, an area of confluence that had once kept a lid on higher levels. The pullback the past couple of sessions is bringing that area into play along with another angle of support via a trend-line from the late September low.
This is making for another confluent level that makes this spot on the chart, seen on both the daily and 4-hr, a very important one for the upcoming days. A former level of resistance getting tested as support is a common technical occurrence and resistance turned support should be respected be respected until broken.
For would-be longs, this could offer an attractive spot to enter the multi-week trend higher towards a test of yet another area of significant confluence in resistance. If support breaks then stops on longs would get triggered, and for those looking to short a break of support may usher in a leg lower.
On the top-side, if support holds, then look for peaks created during July, August, and September in the low 1830s to come into play, along with the confluent trend-line running down off the August 2020 high. That trend-line is part of a macro-sized wedge that has been forming since last year. It could have big meaning as we head into 2022.

Gold Daily Chart
Gold 4-hr Chart

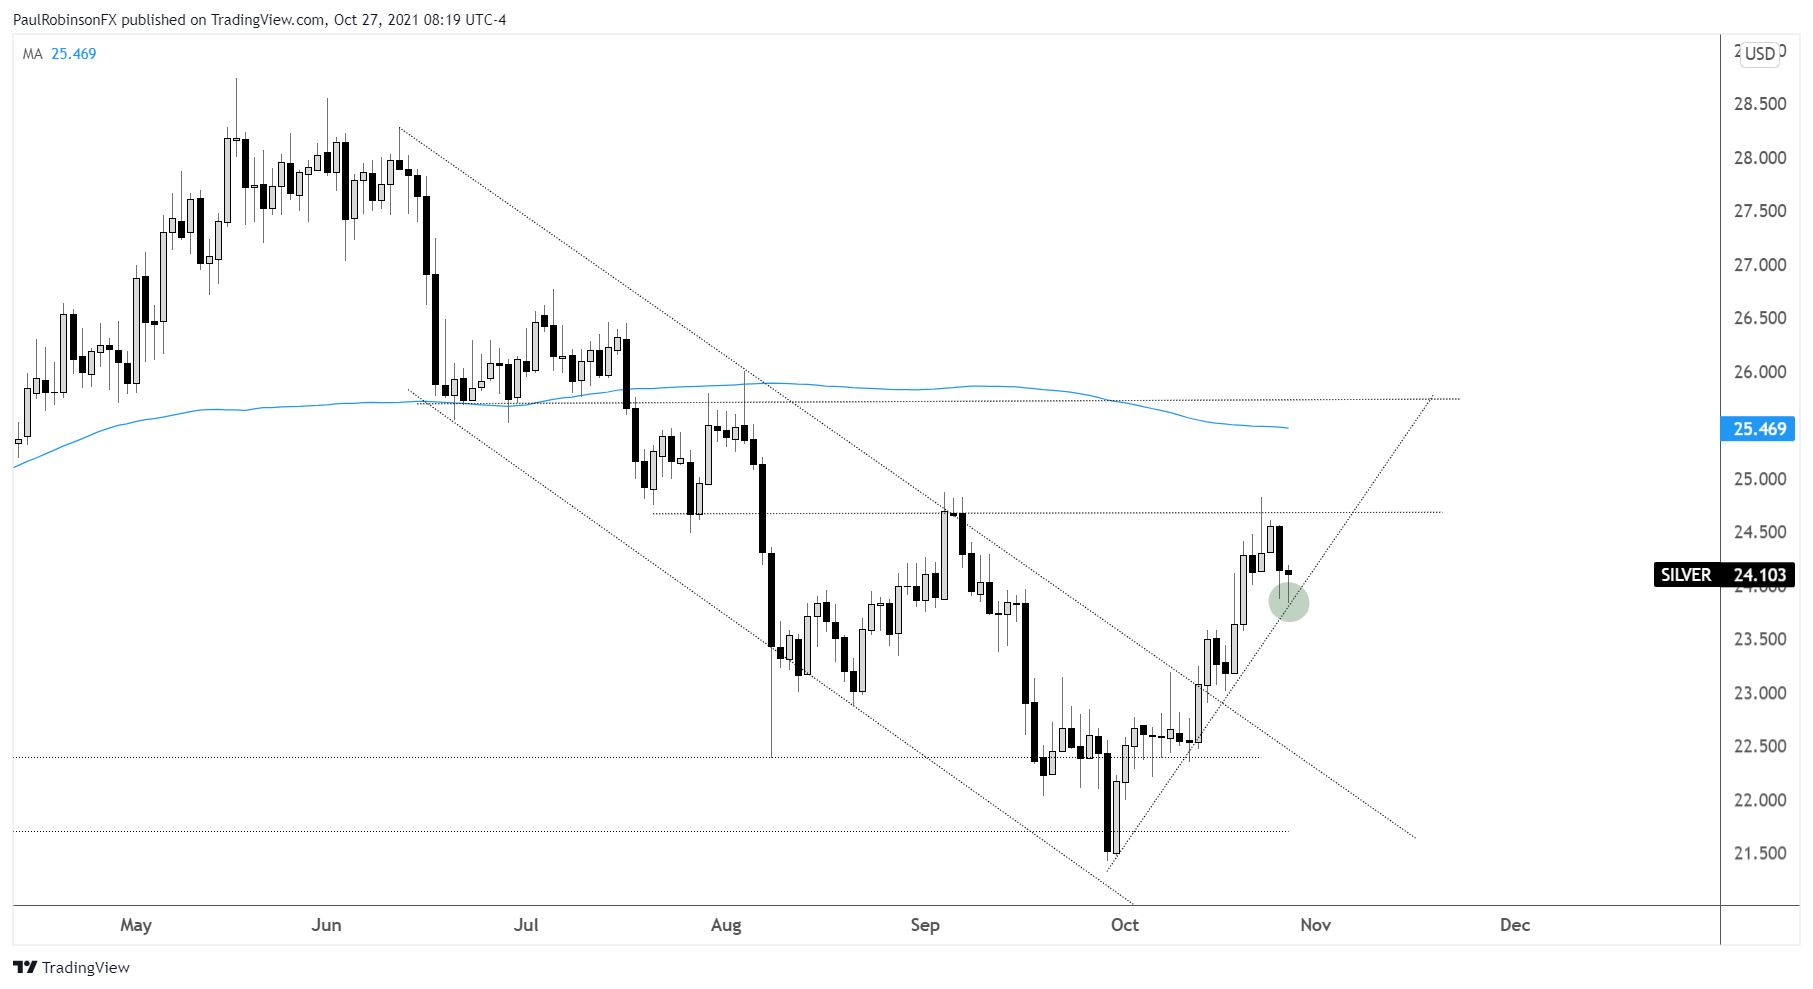
Silver is backing off resistance around 24.75, and on that is testing a trend-line off the September low. It’s not as big of an inflection point as it is for gold, but nevertheless traders can use it as a guide. Stay above and the uptrend trend stays intact as is, break below and a larger move lower could ensue.
Silver Daily Chart
Resources for Forex Traders
Whether you are a new or experienced trader, we have several resources available to help you; indicator for tracking trader sentiment, quarterly trading forecasts, analytical and educational webinars held daily, trading guides to help you improve trading performance, and one specifically for those who are new to forex.
---Written by Paul Robinson, Market Analyst
You can follow Paul on Twitter at @PaulRobinsonFX


