


Gold Price Outlook:
- Gold prices are plodding along below symmetrical triangle support, with momentum indicators starting to point lower.
- It remains the case that until 1835 is overtaken, it’s difficult to have faith in any more upside potential in gold prices given recent technical developments.
- According to the IG Client Sentiment Index, gold prices have a bearish bias in the near-term.

Another Failed Rally?
Following the August US CPI report, which showed US inflation rates starting to subside, gold prices have been unable to find any follow through higher. The bullish outside engulfing bar on Tuesday was met with a bearish inside bar today, cementing another failed attempt to climb back above the 1800 level.
The fact of the matter is that, even as the US Dollar (via the DXY Index) remains broadly weaker from its highs at the end of August, Fed rate hike odds remain firm (pricing in 89-bps through the end of 2023) and the shape of the US Treasury yield curve (as measured by the 2s5s10s butterfly) suggests that tapering is arriving soon.
It’s increasingly looking like the only bullish catalyst gold prices will have in the near-term is a potential breach of the US debt ceiling a la 2011 or a meltdown by China’s Evergrande, but beyond that, there’s little for gold to hang its hat on.
Gold Volatility and Gold Prices’ Abnormal Relationship
Historically, gold prices have a relationship with volatility unlike other asset classes. While other asset classes like bonds and stocks don’t like increased volatility – signaling greater uncertainty around cash flows, dividends, coupon payments, etc. – gold tends to benefit during periods of higher volatility. Falling gold volatility and weak correlations suggests continued difficult trading may be ahead for gold prices.
GVZ (Gold Volatility) Technical Analysis: Daily Price Chart (September 2020 to September 2021) (Chart 1)
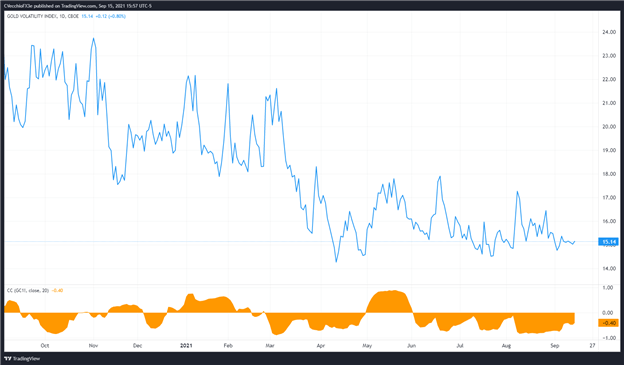
Gold volatility (as measured by the Cboe’s gold volatility ETF, GVZ, which tracks the 1-month implied volatility of gold as derived from the GLD option chain) was trading at 15.14. The relationship between gold prices and gold volatility isn’t necessarily normalizing as gold prices simmer and volatility lurches sideways. The 5-day correlation between GVZ and gold prices is -0.90 while the 20-day correlation is -0.40. One week ago, on September 8, the 5-day correlation was -0.53 and the 20-day correlation was -0.45.
Gold Price Rate Technical Analysis: Daily Chart (August 2020 to September 2021) (Chart 2)
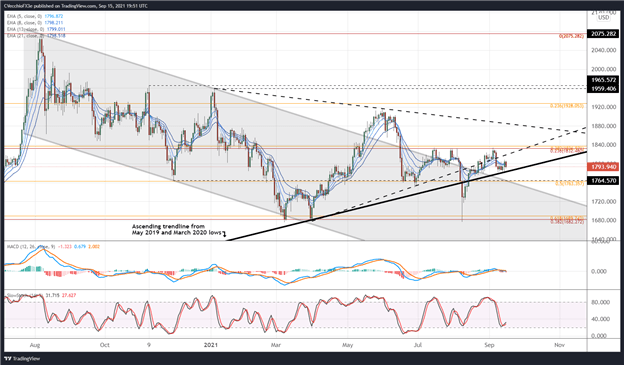
Gold prices have been unable to sustain a move above symmetrical triangle support, keeping pressure towards the ascending trendline from the May 2019, March 2020, and March 2021 lows.
Gold prices have once again dropped below their daily 5-, 8-, 13-, and 21-EMA envelope; the differential between the daily 5- and 21-EMAs is less than 0.2%, suggesting no strong bias. Daily MACD has started to slip back below its signal line, while daily Slow Stochastics climb out of oversold territory has proven feeble.
Bigger picture, failure to overcome the July highs – clearing the 1835 level discussed ad nauseum over the past six weeks – suggests that the pair has bearish technical inclinations in the near-term.
Gold Price Technical Analysis: Weekly Chart (October 2015 to September 2021) (Chart 3)
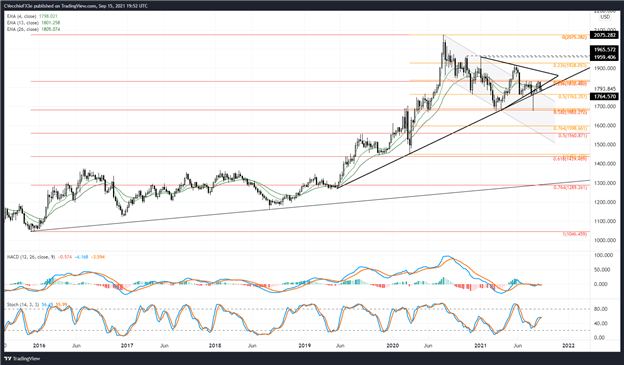
The rebound in gold prices has yet to result in a meaningful turn on the weekly timeframe, which has seen an acceleration higher in its momentum indicators despite failure to overtake the July highs. The weekly 4-, 13-, and 26-EMA envelope is flat, suggesting that the longer-term impulse is neutral. Should gold prices overcome 1835, however, upside potential towards 1860 could be realized rather quickly before symmetrical triangle resistance comes into focus.

IG CLIENT SENTIMENT INDEX: GOLD PRICE FORECAST (September 15, 2021) (CHART 4)
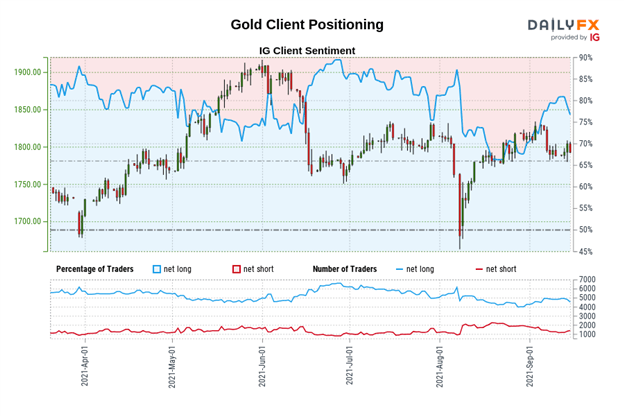
Gold: Retail trader data shows 80.07% of traders are net-long with the ratio of traders long to short at 4.02 to 1. The number of traders net-long is 8.30% higher than yesterday and 0.48% higher from last week, while the number of traders net-short is 13.43% lower than yesterday and 6.11% lower from last week.
We typically take a contrarian view to crowd sentiment, and the fact traders are net-long suggests Gold prices may continue to fall.
Traders are further net-long than yesterday and last week, and the combination of current sentiment and recent changes gives us a stronger Gold-bearish contrarian trading bias.
--- Written by Christopher Vecchio, CFA, Senior Strategist


