


Gold/Silver Price Technical Outlook
- Gold set up to pull back from around the 200-day
- Silver price action is outright bearish-looking

Gold Price & Silver Outlook: XAU and XAG Look Set to Decline
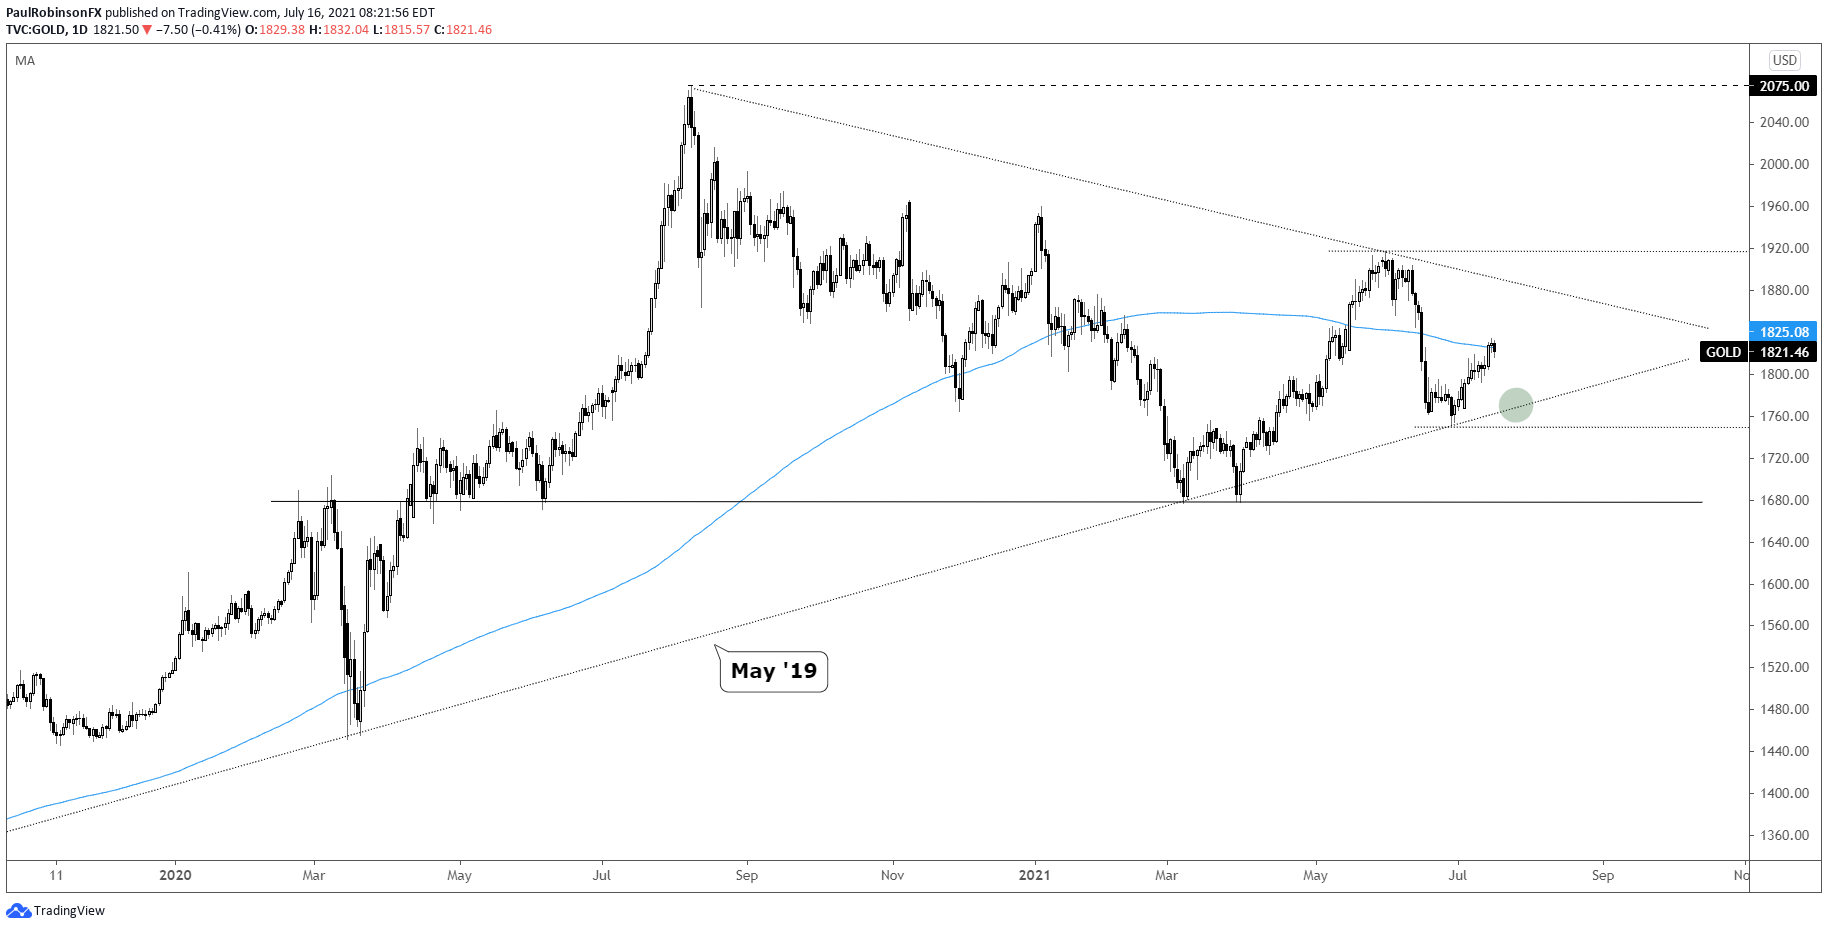
Gold has been steadily rising despite the dollar maintaining a bid, which is a somewhat of a bullish sign. However, the 200-day and further dollar strength may derail the bounce. The rise in price has carved out a wedge formation that in the context of a bounce off a low indicates that a decline could set in quickly if the underside trend-line of the pattern is broken.
The pent up pressure from the narrowing price action could very well lead to a squeeze higher. What matters is which side of the formation is breached. If the underside trend-line is broken, then look for gold to decline back towards the May 2019 trend-line, a threshold recently tested and held. This would be another very meaningful test for gold as a breakdown could send it much lower.
On the flip-side, should gold continue to funnel higher, it may get some separation from the 200-day and rally towards a nearly 1-year long trend-line.
The bottom line is, there is a decent looking ascending wedge off the low to watch and is seen as likely to spark a breakout one way or the other.
Gold Daily Chart
Gold 4-hr Chart

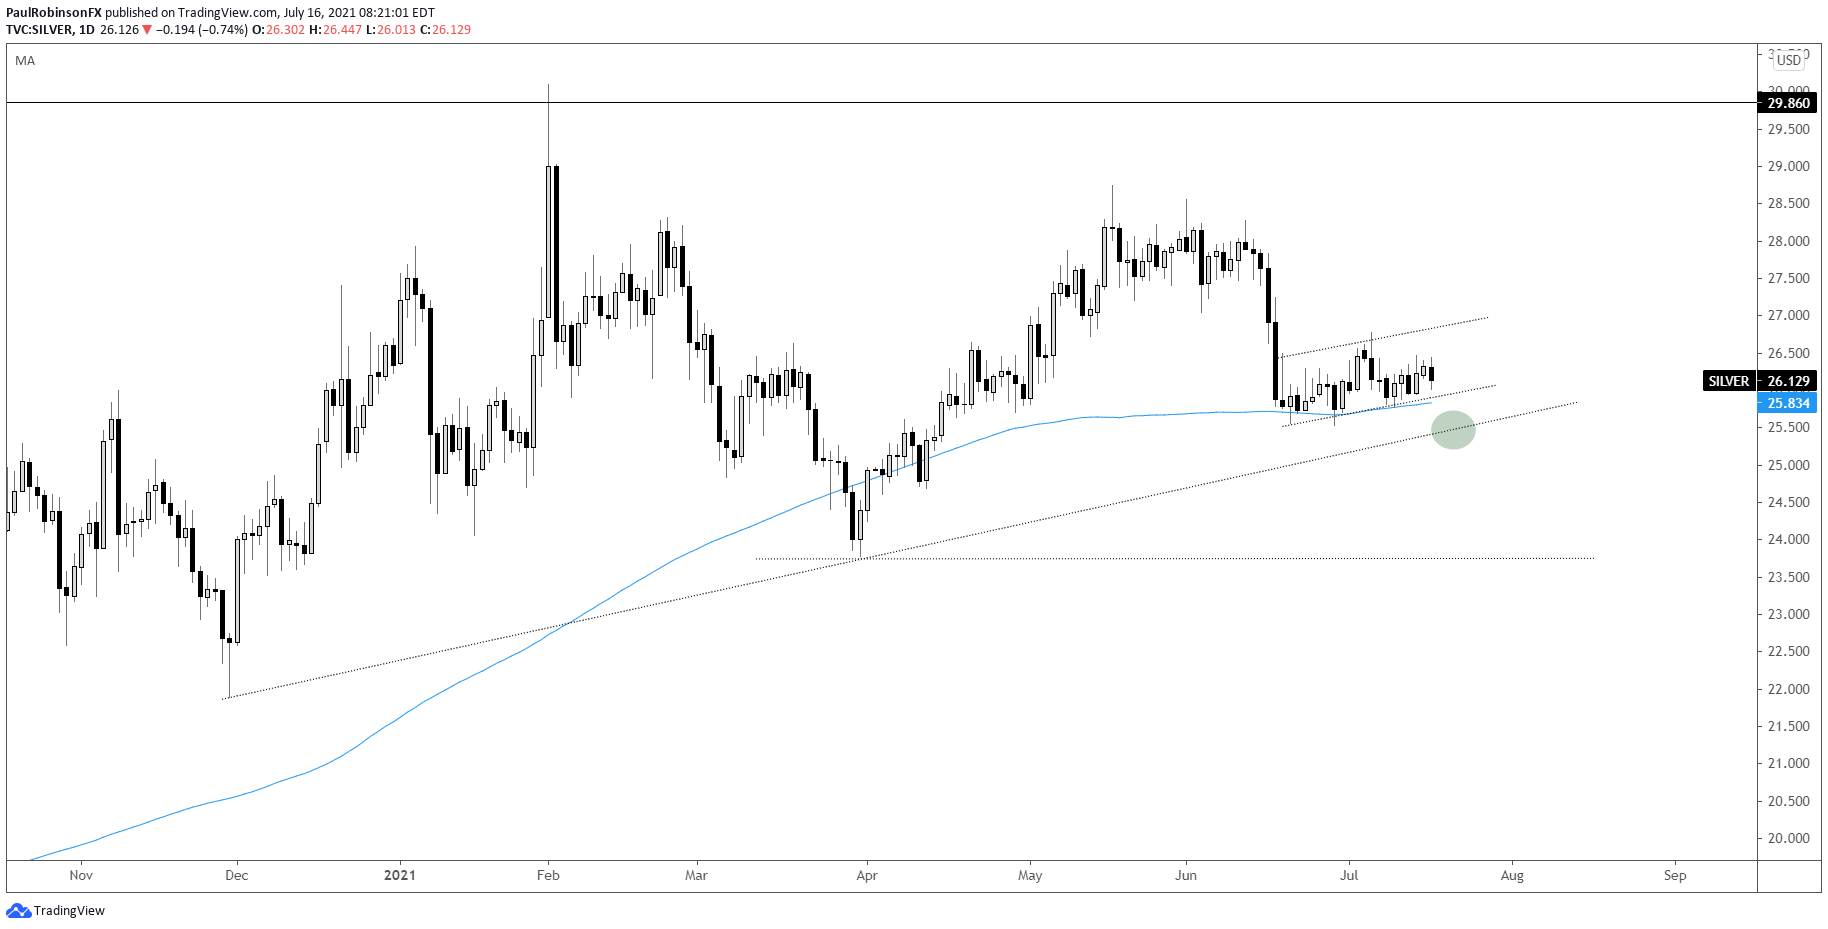
Silver appears outright bearish at this juncture, much more so than gold. The mid-June plunge after the Fed meeting has sparked little buying interest and lead to a sideways meander. This type of price action following a strong move typically indicates there will be some level of follow-through to come.
The 200-day MA has helped keep a floor in during this congestion period that has taken on the shape of a bear-flag. There is some additional support not far below at a trend-line extending over from November. This line is also in confluence with the low of the recent range at 25.52.
This makes for an interesting set-up.
With price action indicating another leg lower and another meaningful level of support nearby, we could see a relatively explosive move lower if support breaks. We will want to pay close attention to how things play out at support (should it reach it) as it could also end the bout of weakness quickly if a strong reaction develops.
For now, running with a downward bias, and that bias could either strengthen significantly or be thwarted upon the testing of another major level of support.
Silver Daily Chart
Resources for Forex Traders
Whether you are a new or experienced trader, we have several resources available to help you; indicator for tracking trader sentiment, quarterly trading forecasts, analytical and educational webinars held daily, trading guides to help you improve trading performance, and one specifically for those who are new to forex.
---Written by Paul Robinson, Market Analyst
You can follow Paul on Twitter at @PaulRobinsonFX


