Gold/Silver Technical Highlights
- Gold price may continue to sag in the near-term
- Long-term charts show a healthy correction in bull market
- Silver similar situation, large consolidation pattern developing
Gold, silver charts near-term bearish, long-term bullish
Precious metals have been left out in the cold with BTC/USD stealing some their thunder. Gold price has been unusually weak despite a solidly weaker dollar the past few months. But this doesn’t mean the good old days over, necessarily.
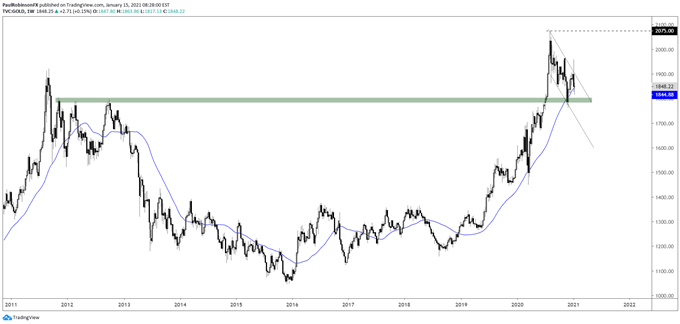
Dialing back to the big picture, gold (&silver) appear to be putting in healthy corrective periods within the context of a bull market. Later on this should bode well for the precious metal sector as these types of periods in solid trends often lead to powerful continuations.
It might just take a while longer.
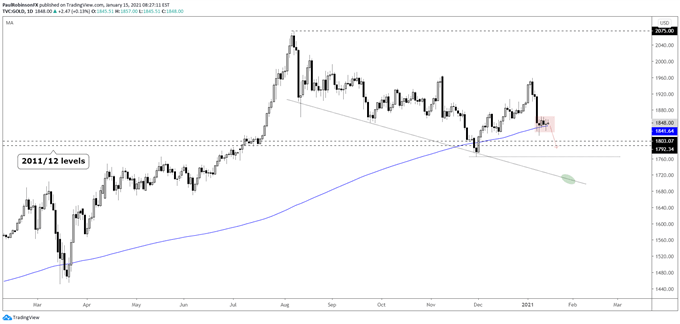
In the near-term, after getting slammed last week, price is trading on the 200-day MA. The failure to rally off this threshold is leading to a horizontal pattern that suggests we could see further downside in the days ahead.
Support to watch clocks in from around 1800 down to 1764. If that were to break the near-term picture would continue to funnel lower, but more broadly speaking it will take more to undermine the extended period of digestion.


Gold Daily Chart (may continue lower)

Gold Weekly Chart (bull market correction)

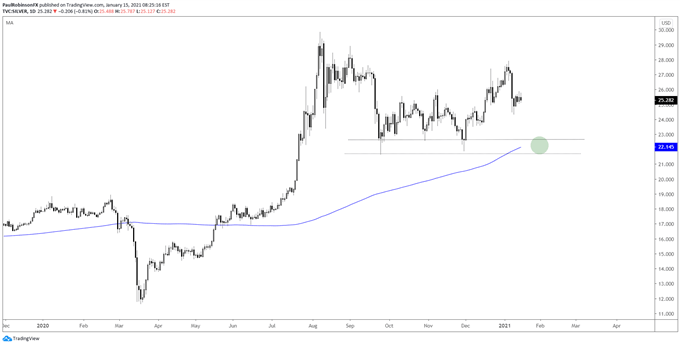
Silver of course looks similar to gold and is likely to follow a similar fate. In the near-term, it looks vulnerable with significant support not arriving until down around the 22.60/21.66 area. There is good price support down there along with the rising 200-day clocking in at 22.14. Overall, a hold of that spot on the charts would keep the horizontal move going for what could amount to a launching pad later on for the next move higher.
Silver Daily Chart (looking lower within larger consolidation pattern)

Resources for Forex Traders
Whether you are a new or experienced trader, we have several resources available to help you; indicator for tracking trader sentiment, quarterly trading forecasts, analytical and educational webinars held daily, trading guides to help you improve trading performance, and one specifically for those who are new to forex.
---Written by Paul Robinson, Market Analyst
You can follow Paul on Twitter at @PaulRobinsonFX


