


Gold Price Technical Outlook:
- Gold trading below the 200-day MA & price support from 2011/12
- Could this be a wash-out move before it turns around?
- USD weakness hasn’t mattered, but that may change
Gold breaking support could be a wash-out move, watch USD
Gold traded below the 200-day SMA on Friday and is continuing its run of weakness to start the new week. The move lower also has support during the 2011/12 topping process getting breached. Could the sudden rush lower be a wash-out of weaker hands as price continues a corrective move in a bull market, or are we seeing the beginnings of a much larger top?
For now it appears to be too soon to call the August high the top, but it doesn’t mean it wasn’t. It’s just that tops tend to take some time to realize and lead to material declines. The generally bumpy price action since the August high hasn’t been overly aggressive to the downside. This bit of selling we are seeing in recent sessions though may be a wash-out move for sorts.
There is another level of support to watch here that could make up the bottom-side line of a bull-flag pattern that may later on help send gold much higher should it fully mature. But it will be important that gold holds here as it tests the bottom of the would-be pattern.
The correlation to the dollar has broken down significantly as both gold and the DXY are currently trading lower together. The 20-day correlation between gold and the DXY area a statistically significant 0.62, a reading that doesn’t often hold long before reverting back into negative territory.
But how will that play out? With the DXY probing below long-term support, we may see the USD’s influence on gold become a factor again and help push gold higher. It could of course play out in opposite fashion, or something in between. But do keep an eye right on gold as the DXY breaks big support at 91.74.

Gold Price Daily Chart (<200-day, price support; watch underside parallel)
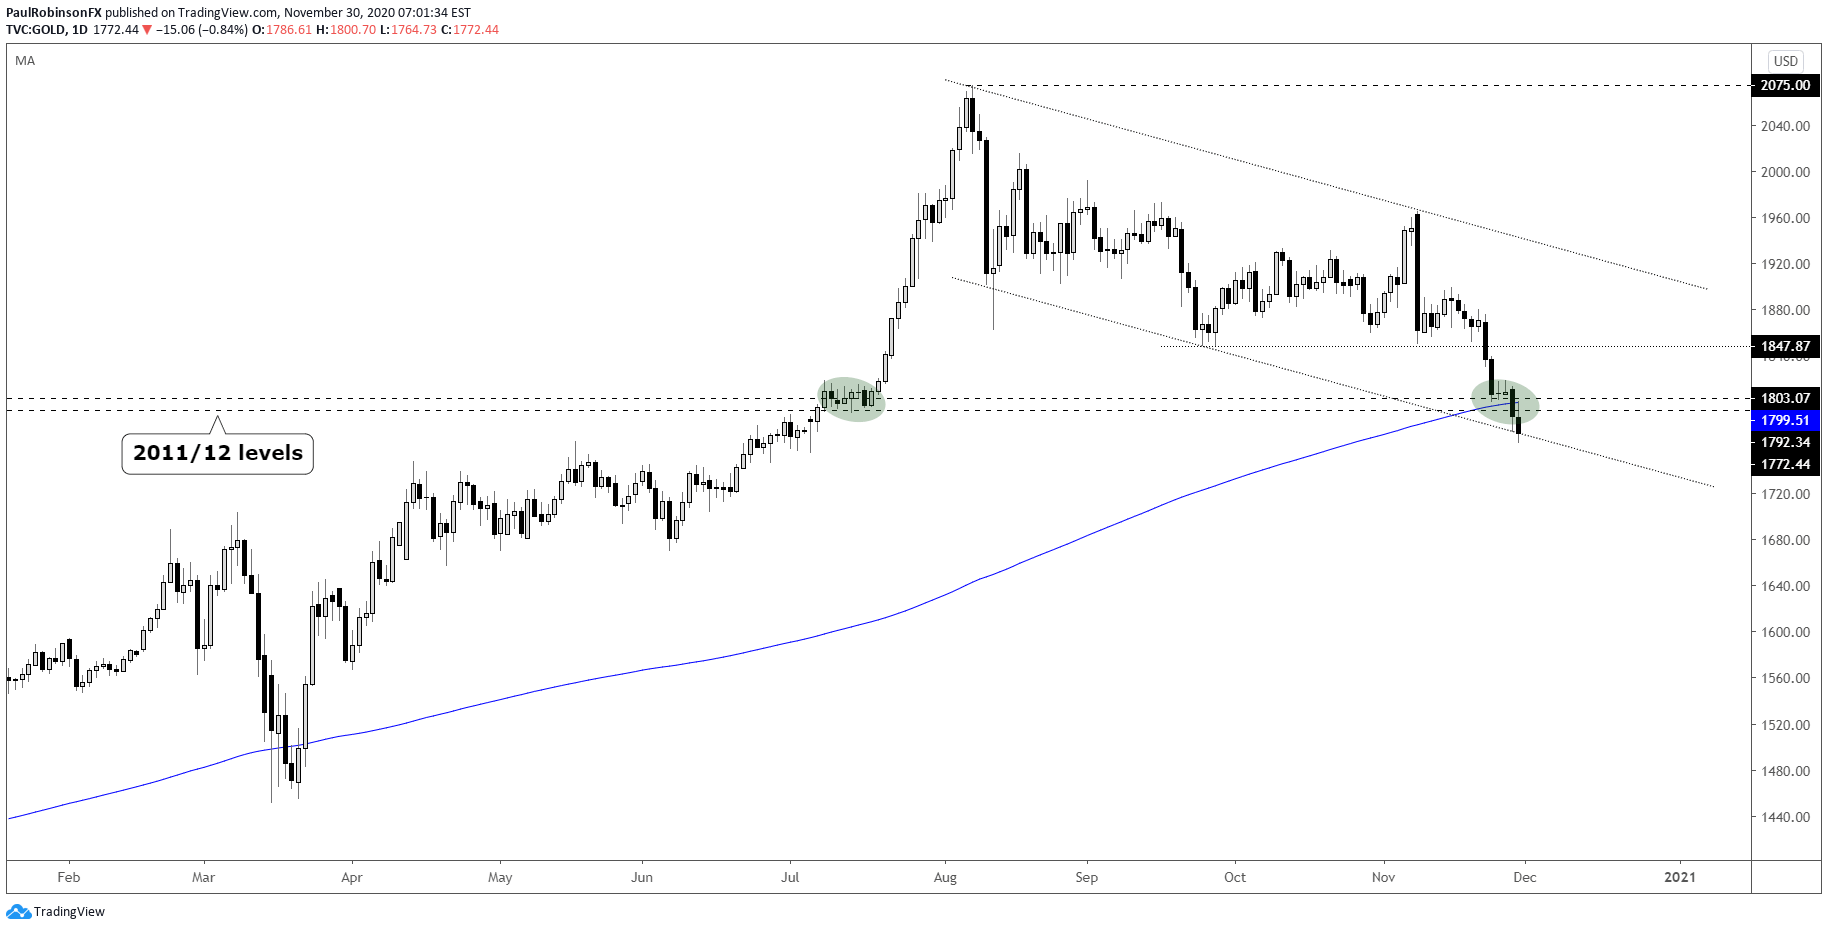
Gold Price Chart by TradingView
DXY Monthly Chart (dipping below long-term support)
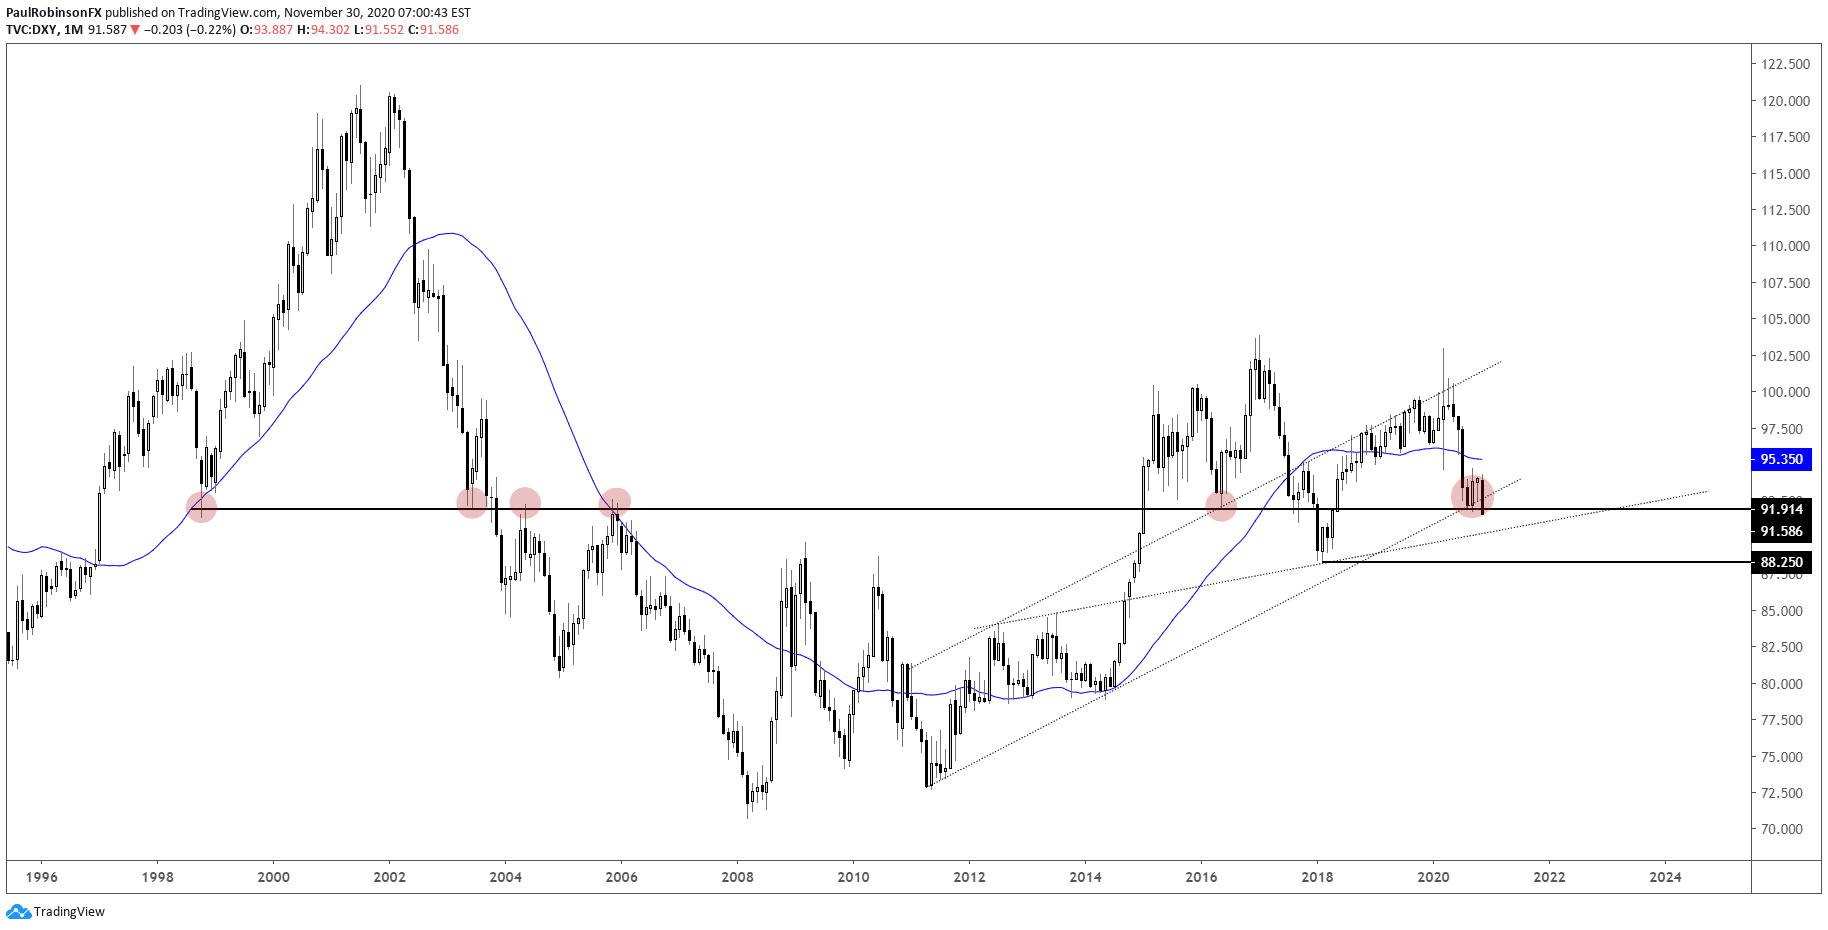
US Dollar Index (DXY) Chart by TradingView
Resources for Forex Traders
Whether you are a new or experienced trader, we have several resources available to help you; indicator for tracking trader sentiment, quarterly trading forecasts, analytical and educational webinars held daily, trading guides to help you improve trading performance, and one specifically for those who are new to forex.
---Written by Paul Robinson, Market Analyst
You can follow Paul on Twitter at @PaulRobinsonFX


