Gold Price & Silver Technical Highlights:
- Gold sitting on a minor level of support, break brings into play big support
- Silver price action is choppy, but could be narrowing towards a wedge
Gold weakness could soon bring big support into play
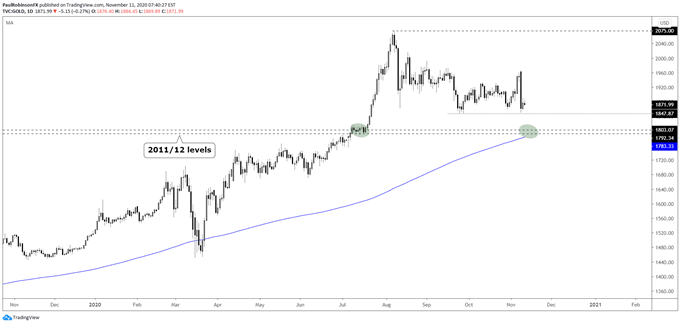
Gold was kicked hard on Monday with the announcement of Pfizer’s progress for a coronavirus vaccine, and on that near-term support from late September at 1848 is under siege. It is has been difficult trying to get a handle on gold with its choppiness, but a test of a long-term support may help bring some clarity.
A drop below 1848 will bring into play levels from the 2011/12 topping process that gold hesitated at back in July before exploding to new record highs. It is also an area where the 200-day moving average happens to moving higher into; 1800 (+15/-15) is looking like a big spot right now.
A drop into support could forge a corrective low in the longer-term trend higher, while a breakdown below will leave the door open for further losses. Watch how price action behaves should we soon see a test take shape – a violent reversal or sudden surge will indicate a strong willingness by buyers to step in.


Gold Price Daily Chart (~1800 a big spot)

Gold Price Chart by TradingView
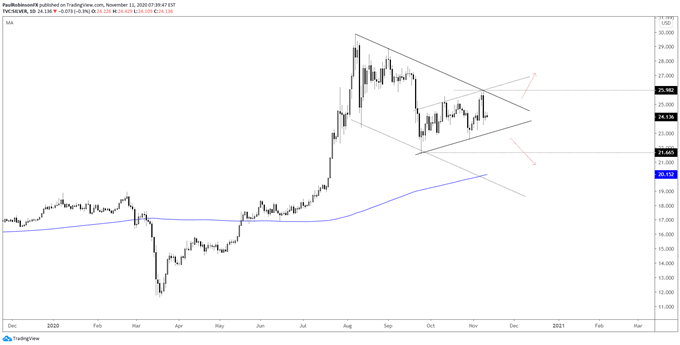
Silver hasn’t been as weak as gold recently with it still well above the September low. There are some cross-currents in play as the price action is generally choppy and without directional cues. Overall, despite the two channels in opposing directions forming, price action is starting to wedge up a bit.
It isn’t the cleanest pattern with particularly great symmetry, but it does imply that at some juncture the narrowing range will lead to a breakout. For now, continue to stay on hold while clarity presents itself.
Silver Price Daily Chart (wedge could be forming)

Silver Price Chart by TradingView
Resources for Forex Traders
Whether you are a new or experienced trader, we have several resources available to help you; indicator for tracking trader sentiment, quarterly trading forecasts, analytical and educational webinars held daily, trading guides to help you improve trading performance, and one specifically for those who are new to forex.
---Written by Paul Robinson, Market Analyst
You can follow Paul on Twitter at @PaulRobinsonFX


