


Gold Price Technical Highlights:
- Gold correction may be near an end, but…
- It could just as easily continue…
- Watch which way it breaks out of short-term pattern
Gold correction over or more to come?
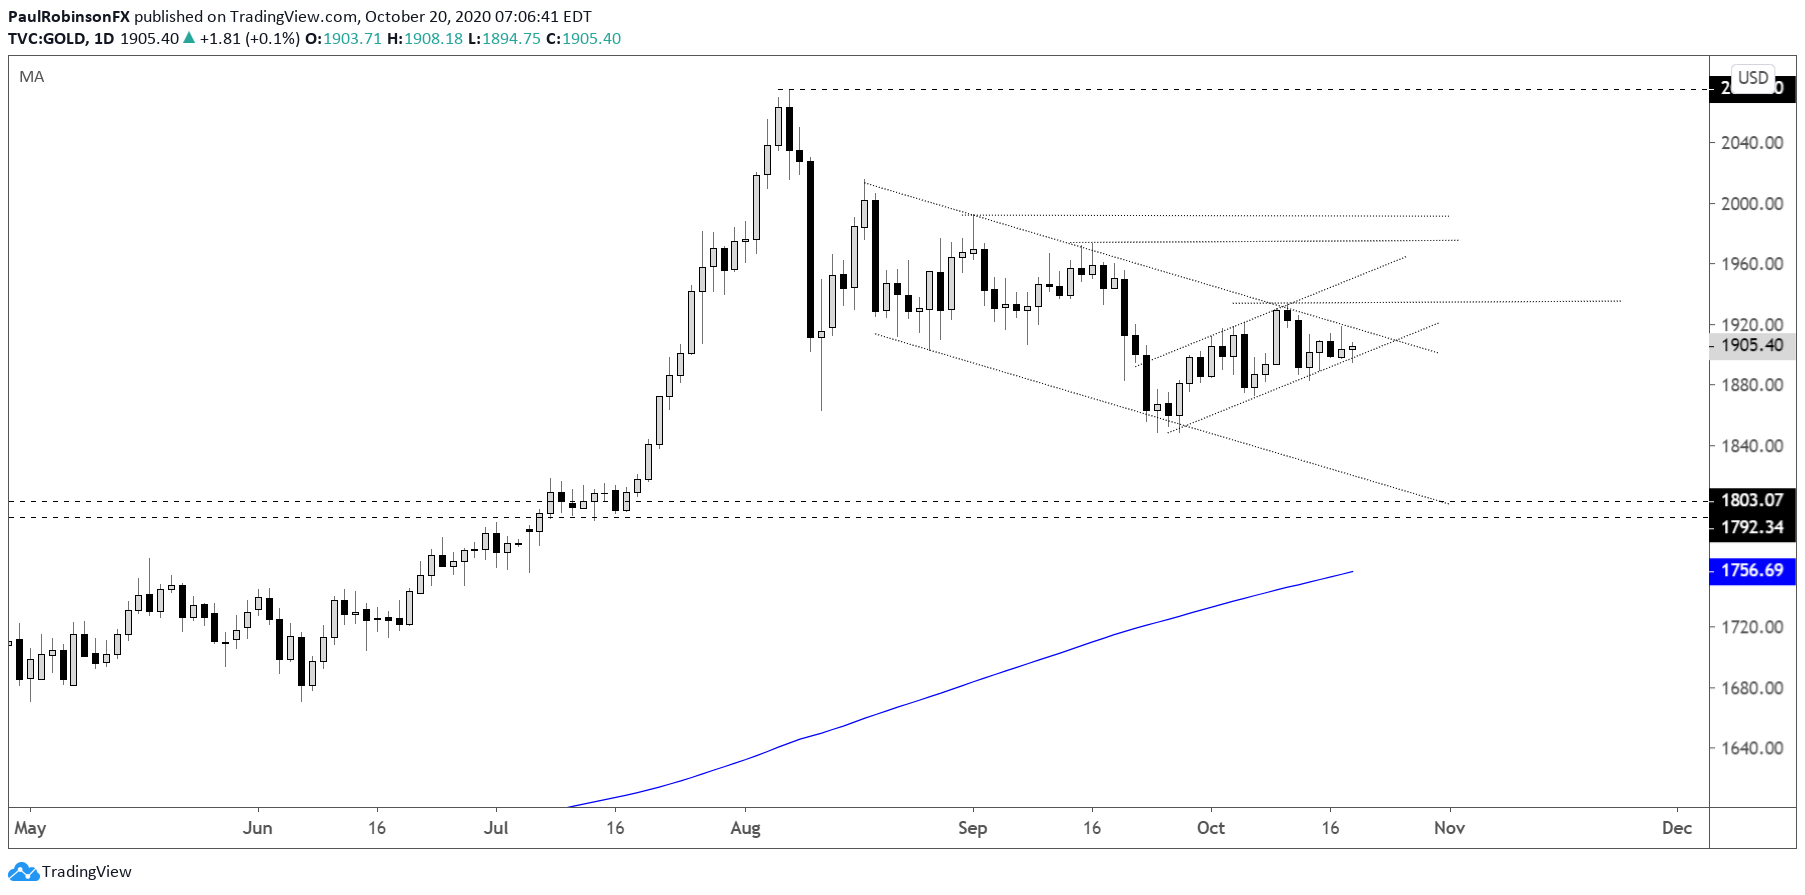
The bull market in gold has been in correction mode since it peaked in early August, and while it appears is a healthy retracement at this juncture, it is unclear just how much longer it will last. It could just as easily continue to go on as it could be nearing its end.
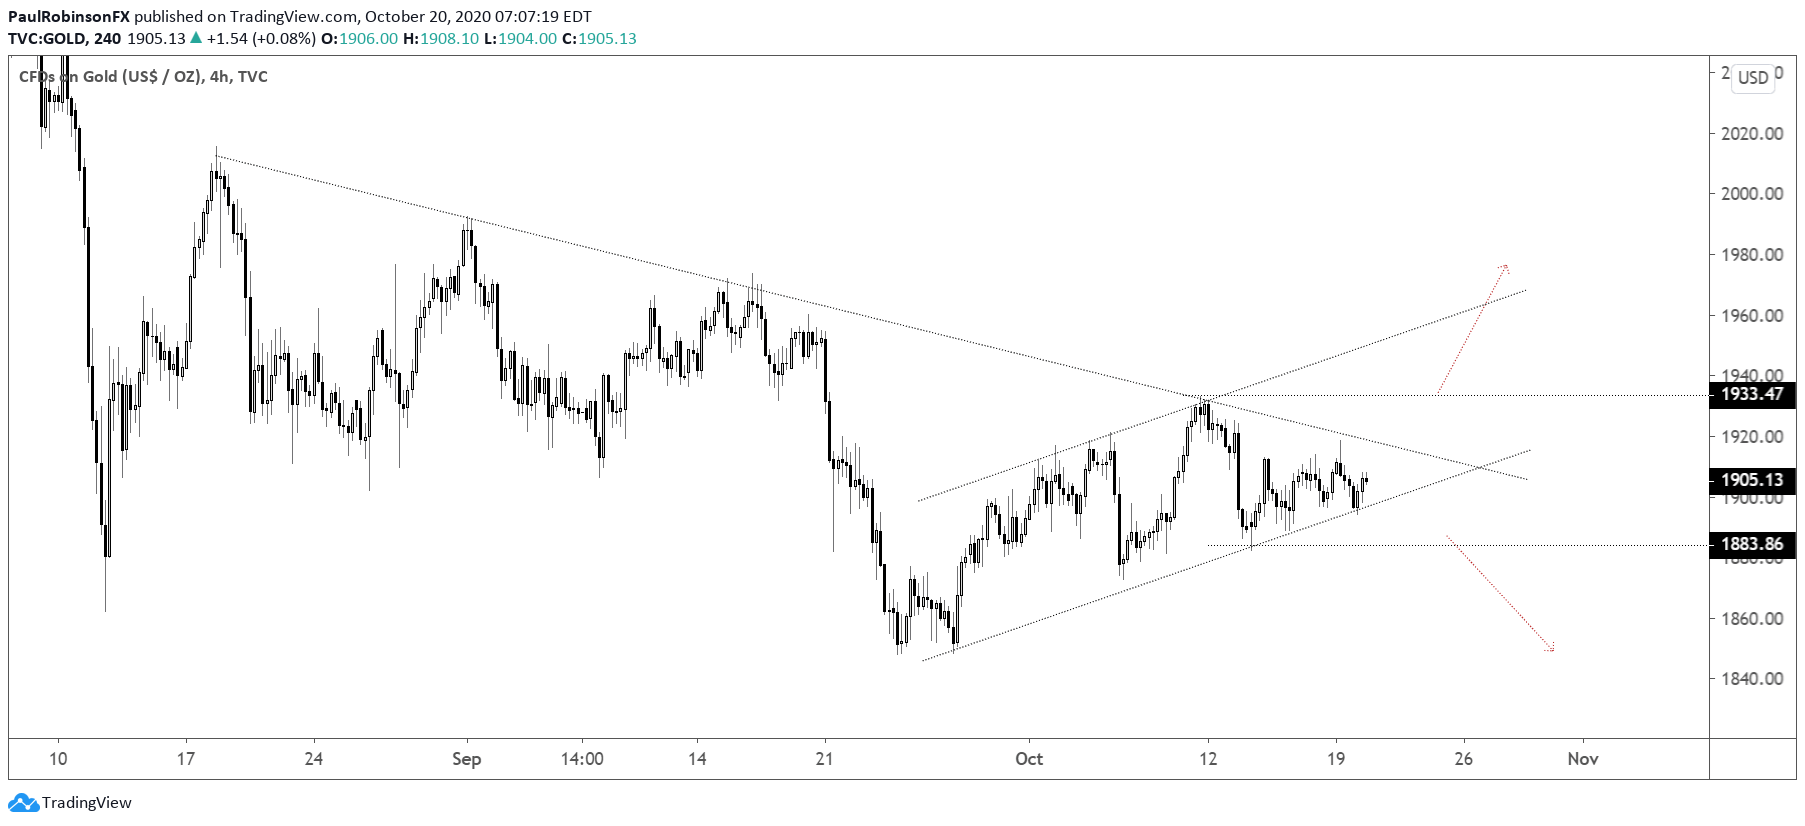
This is where the short-term charts comes into play. Off the September low price has been channeling higher in a fashion that hasn’t invoked much confidence, and if the lower parallel were to break then another leg lower towards 1848 or worse looks probable.
This would off course mean the resumption of the longer-term trend will be on hold for a while longer, if it is to resume at all. For now, not a lot of reason to believe the longer-term trend won’t resume.
On the flip-side, the channeling price action has gold up against a solid trend-line dating back to the middle of August. A breakout above this trend-line will have price broken free from the near-term wedge on the 4-hr time-frame as well.
A break above 1933 will confirm the breakout and put gold in position to rally from the 2.5 month long corrective pattern. In the event we see a breakout it might not take long to see a rally back to 2075 and beyond.
All-in-all, it might not take much longer before we have a resolution that gives short-term traders some movement to trade on, but also a cue for longer-term players trying to time when the gold correction may be coming to an end…

Gold Price Daily Chart (correction to continue or end?)
Gold Price 4-hr Chart (a breakout looks near)
Gold Price Charts by TradingView
Resources for Forex Traders
Whether you are a new or experienced trader, we have several resources available to help you; indicator for tracking trader sentiment, quarterly trading forecasts, analytical and educational webinars held daily, trading guides to help you improve trading performance, and one specifically for those who are new to forex.
---Written by Paul Robinson, Market Analyst
You can follow Paul on Twitter at @PaulRobinsonFX


