


Gold Price & Silver Technical Highlights:
- Gold price decline from triangle has room to 1800-area
- Silver decline was strong, but now has trend-line support
Gold price decline from triangle has room to 1800-area
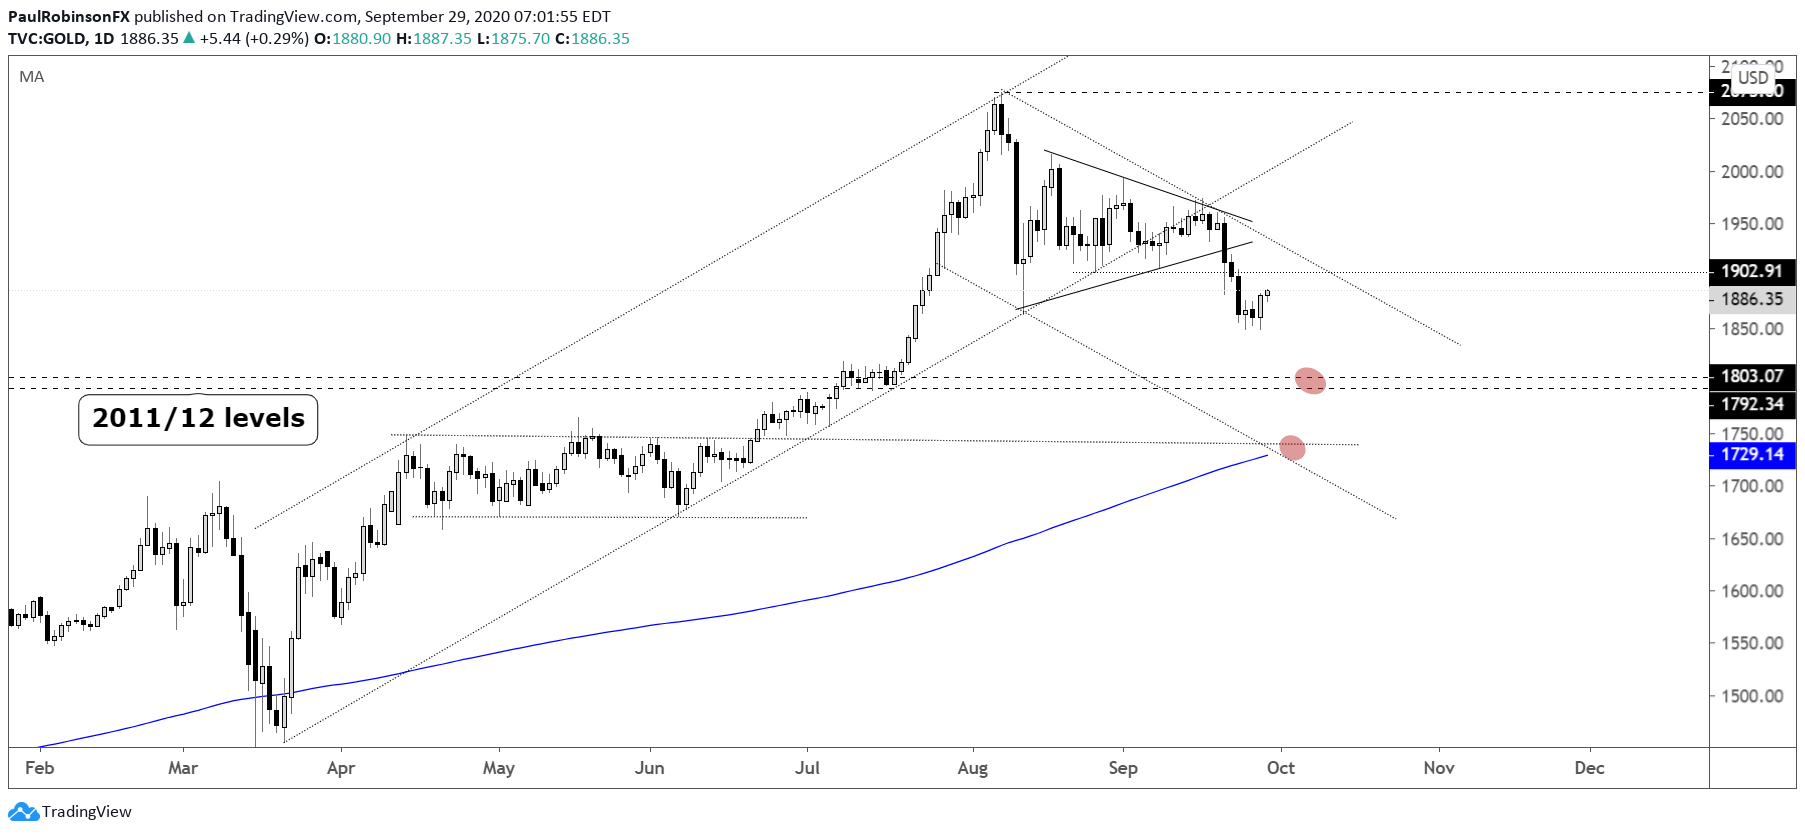
Gold broke down from a triangle formation not too long ago, and given the lack of immediate support and no strong counter-reaction, bullion looks to have further weakness ahead before significant support is met around the 1800-area.
This important area to watch arrives around 1803 and ends around 1770. This means from current levels there is a decent amount of room for gold to drop and short-term traders to maintain a bearish trading bias. If price gets to the noted zone, then a sizable reaction could occur.
This support was created in the wake of the 2011 peak as the topping process carved out three more peaks into 2012 before seeing gold succumb to an extended bear market. It would be a good spot to watch for a bigger picture bottom to develop. If not there, then the 200-day moving average running up at 1729 would be another significant spot to watch for a meaningful low.
To put a bearish trading bias to rest, gold has some work to do on the top-side. First, it will need to trade back through the apex of the triangle (~1945) and hold onto any rally that can get it that far. For now, though, just keeping in mind what is in front of us – weak price action after a solid pattern break.

Gold Price Daily Chart (triangle break to lead to 1800?)
Gold Price Weekly Chart (1800 area strong, from 2011/12)

Gold Price Charts by TradingView
Silver decline was strong, but now has trend-line support
Silver got hit harder than gold during the recent bout of weakness for precious metals, but it may hold better than gold on any further selling as it has trend-line support at its feet. The September 24 reversal candle helped further cement the importance of the March trend-line.
As long as the trend-line holds and the reversal day low at 21.66, then silver may remain supported. It will be interesting to see if it can hold up though in the face of gold declining to the 1800-area. If it does, then the relative strength factor could make silver a good selection from the long-side later on…
Silver Daily Chart (watch trend-line support)

Resources for Forex Traders
Whether you are a new or experienced trader, we have several resources available to help you; indicator for tracking trader sentiment, quarterly trading forecasts, analytical and educational webinars held daily, trading guides to help you improve trading performance, and one specifically for those who are new to forex.
---Written by Paul Robinson, Market Analyst
You can follow Paul on Twitter at @PaulRobinsonFX


