


Weekly Technical Gold Price Forecast: Neutral
- Long positioning has thinned out in recent weeks, suggesting that the recent triangle consolidation in context of the uptrend may be pointing to higher gold prices.
- Overall, gold prices still have both fundamental (expansionary fiscal and monetary policies, producing negative real yields) and technical (triangle consolidation during an uptrend) tailwinds at their back.
- The IG Client Sentiment Index suggests that gold prices in USD-terms (XAU/USD) have a bullish outlook.

Gold Prices Week in Review
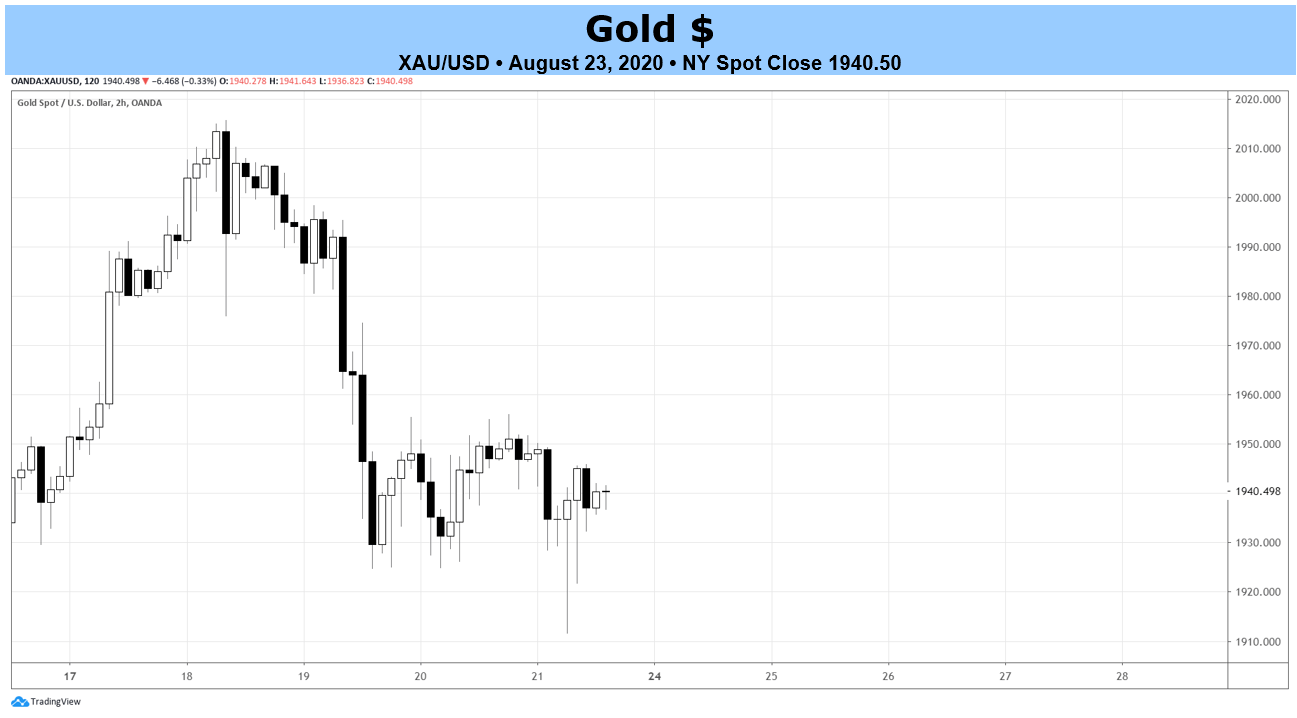
When the dust settled, gold prices had a fairly inefficient week, carving out dojis in six of the eight major XAU-crosses. While the average XAU-cross finished lower by -0.28%, four pairs had smaller losses while two pairs posted gains (XAU/CHF and XAU/EUR). Gold prices posted their worst losses in CAD-terms (XAU/CAD -0.90%) and JPY-terms (XAU/JPY -0.95%). Gold prices in USD-terms (XAU/USD) was one of those pairs that carved out a weekly doji, falling by a mere -0.22% by market close on Friday, August 21.
Nevertheless, gold prices still have both fundamental and technical tailwinds at their back. Thanks to expansionary monetary policy and thus far underwhelming fiscal policy responses, mixed with the global economic uncertainty brought about by the coronavirus pandemic, real yields continue to fall and remain depressed. An environment defined by depressed and/or negative real yields has historically proven bullish for precious metals. With the Federal Reserve’s Jackson Hole Economic Policy Symposium coming over the next few days, a reminder of the dour economic conditions and the needed ongoing extraordinary monetary stimulus measures may draw interest back to precious metals, in particular gold prices.
Gold Prices Enter Bullish Triangle Consolidation
The volatility seen in gold prices throughout August may have yielded a consolidation in the form of a triangle, finding resistance from the August swing highs and support from the March, June, and August swing lows. Such an occurrence in context of the multi-month uptrend speaks to greater upside potential over the coming weeks.
Gold Price (XAU/USD) Technical Analysis: Daily Chart (August 2019 to August 2020) (Chart 1)
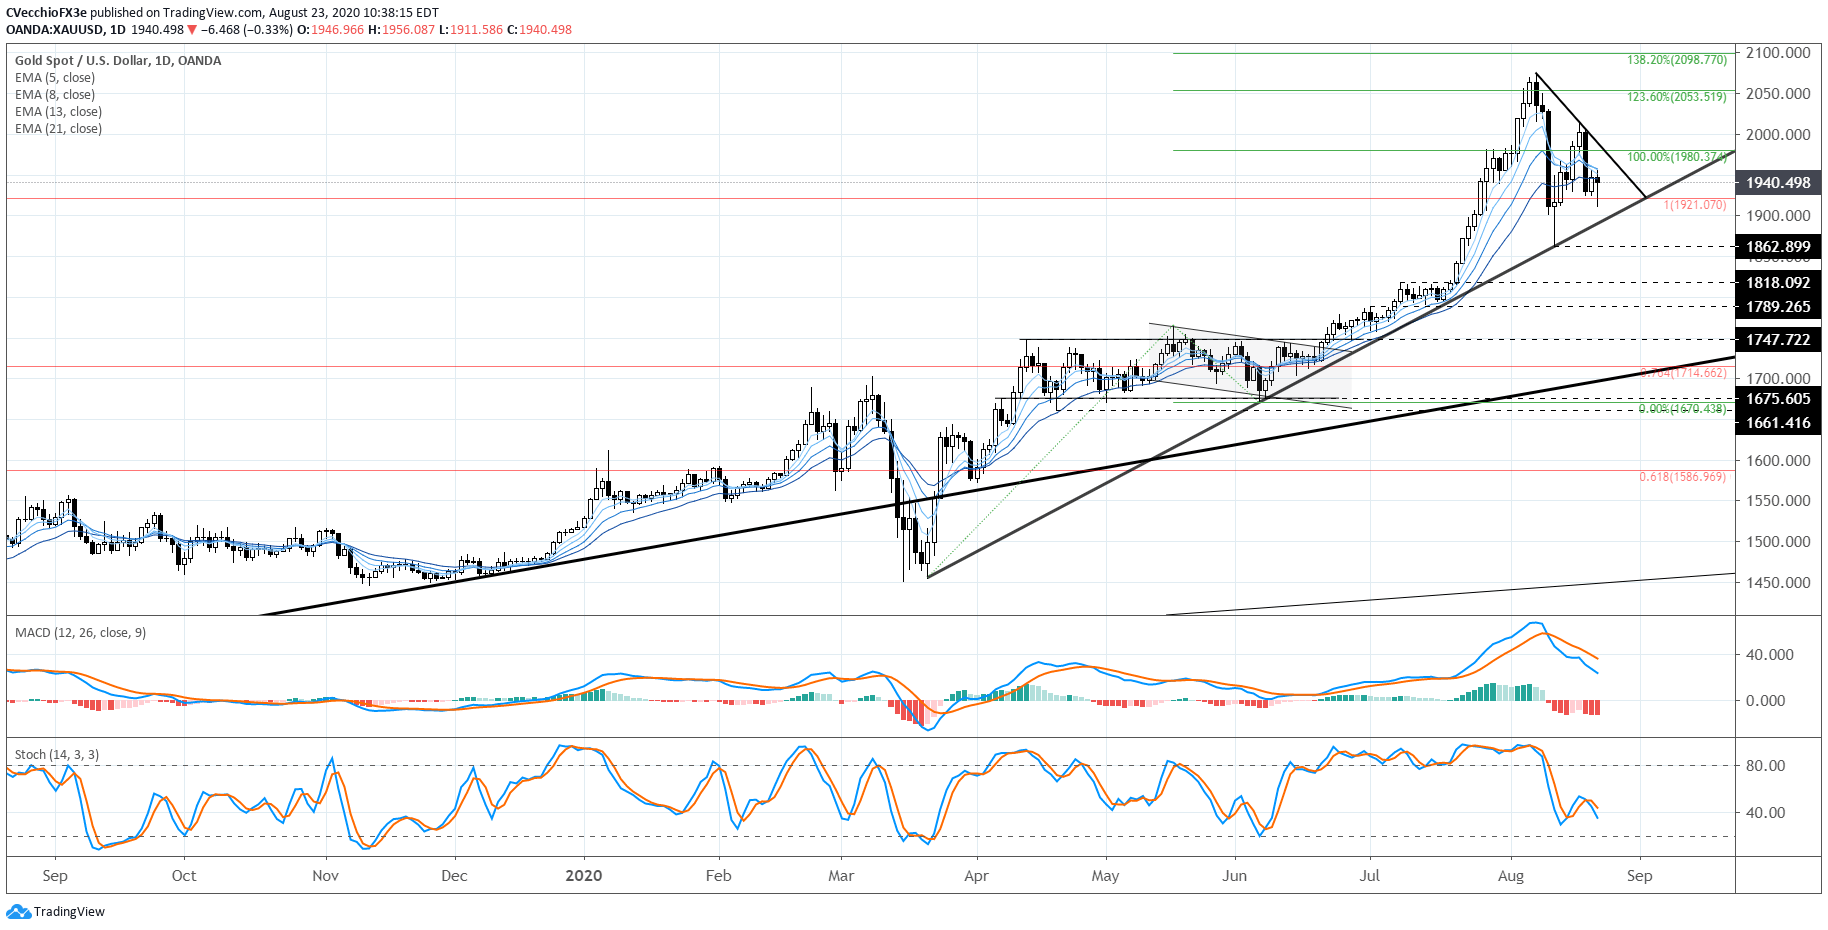
It is important to note that the pullback in gold prices during August halted at two key levels: the rising trendline support from the March and June 2020 lows –the coronavirus pandemic trendline; and the former all-time high near 1921.07. The first test of support arrived as the daily candle carved out a doji; and the second test appeared as a hammer candle on the daily chart. Concurrently, these are signs that the all-time high is a significant zone of demand.
Gold Price (XAU/USD) Technical Analysis: Weekly Chart – Inverse Head and Shoulders Pattern (August 2011 to August 2020) (Chart 2)

“Gold prices have completed the inverse head and shoulders pattern first identified in mid-2019. Depending upon the placement of the neckline, the final upside target was 1820.99. The long-term gold thesis is now evolving, but with the bottoming effort completed, we can now turn our attention to all-time highs at 1921.07 – and well-beyond over the coming months.” Gold prices failing through the former yearly high at 1921.07 would be a major warning sign for gold bulls. A loss of the August low at 1862.90 would be a very important development insofar as redefining the recent consolidation as a topping effort rather than a bullish continuation effort.
GOLD PRICE VERSUS COT NET NON-COMMERCIAL POSITIONING: DAILY TIMEFRAME (August 2019 to August 2020) (CHART 3)
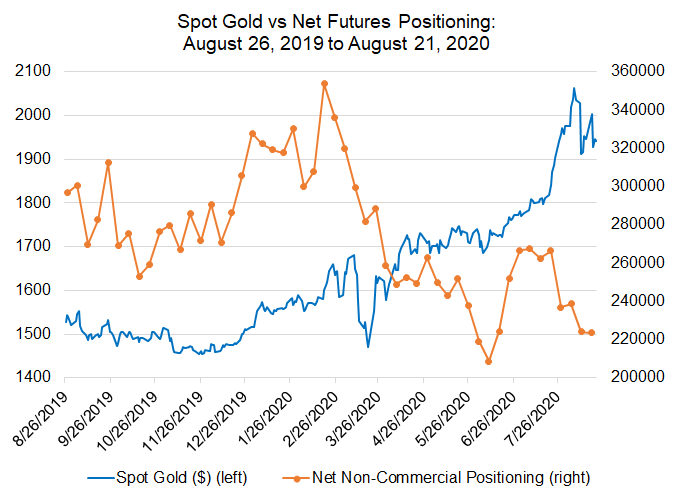
Next, a look at gold positioning in the futures market among speculators. According to the CFTC’s COT data for the week August 18, speculators decreased their net-long gold futures positions to 223.5K contracts, down from the 224.1K net-long contracts held in the week prior.
Even as gold prices consolidate after touching a fresh all-time high earlier this month, net-long gold positioning in the futures market is still well-below its highs from earlier this year, when there were 353.6K net-longs held in February. The continued drawdown in net-longs held by speculators has been met by gold prices sustaining their gains; this is evidence of a strong market with plenty of room to the upside.
IG CLIENT SENTIMENT INDEX: GOLD PRICE FORECAST (AUGUST 21, 2020) (CHART 4)
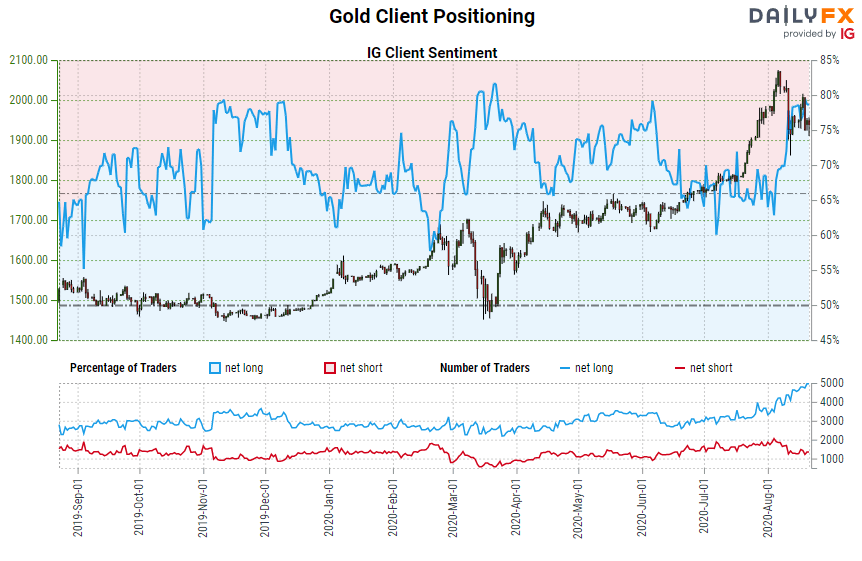
Gold: Retail trader data shows 76.85% of traders are net-long with the ratio of traders long to short at 3.32 to 1. The number of traders net-long is 5.53% lower than yesterday and 1.46% higher from last week, while the number of traders net-short is 0.35% higher than yesterday and 2.75% higher from last week.
We typically take a contrarian view to crowd sentiment, and the fact traders are net-long suggests Gold prices may continue to fall.
Yet traders are less net-long than yesterday and compared with last week. Recent changes in sentiment warn that the current Gold price trend may soon reverse higher despite the fact traders remain net-long.

--- Written by Christopher Vecchio, CFA, Senior Currency Strategist


