


Gold Price Technical Highlights:
- Gold churning sideways could set up a nice base
- A drop below 1658 would undercut this notion
Gold churning sideways could set up a nice base
Recently gold hasn’t been a particularly friendly place for traders to be between its choppy price action and inability to rally despite a solid decline in the price of the Dollar vs most currencies. But this sideways price action may yet be setting gold up for another run, and in fact the longer the base the more bullish the move could be.
At the moment making this determination isn’t easy with risk still alive for price to decline and take out 1658, furthering along a bearish bias. However, the trend since 2018 is up and with that whenever gold has pulled back or moved sideways the price action has eventually resolved itself back in the direction of the path of least resistance.
For now, keep an eye on 1658 as a worst case level for the range to hold onto to keep the upward bias intact. A breakdown out of the range could lead to a test of the 200-day at 1573 or worse. On the upside, watch the high at 1765 as the breakout level.
If this process of consolidating and breaking out were to take a few more weeks all the better, as it could give gold the power to run through the triple peaks of resistance from 2011/12 set around the 1800 threshold. This inflection point stands between here and the record high at 1920.

Gold Price Daily Chart (churning sideways)
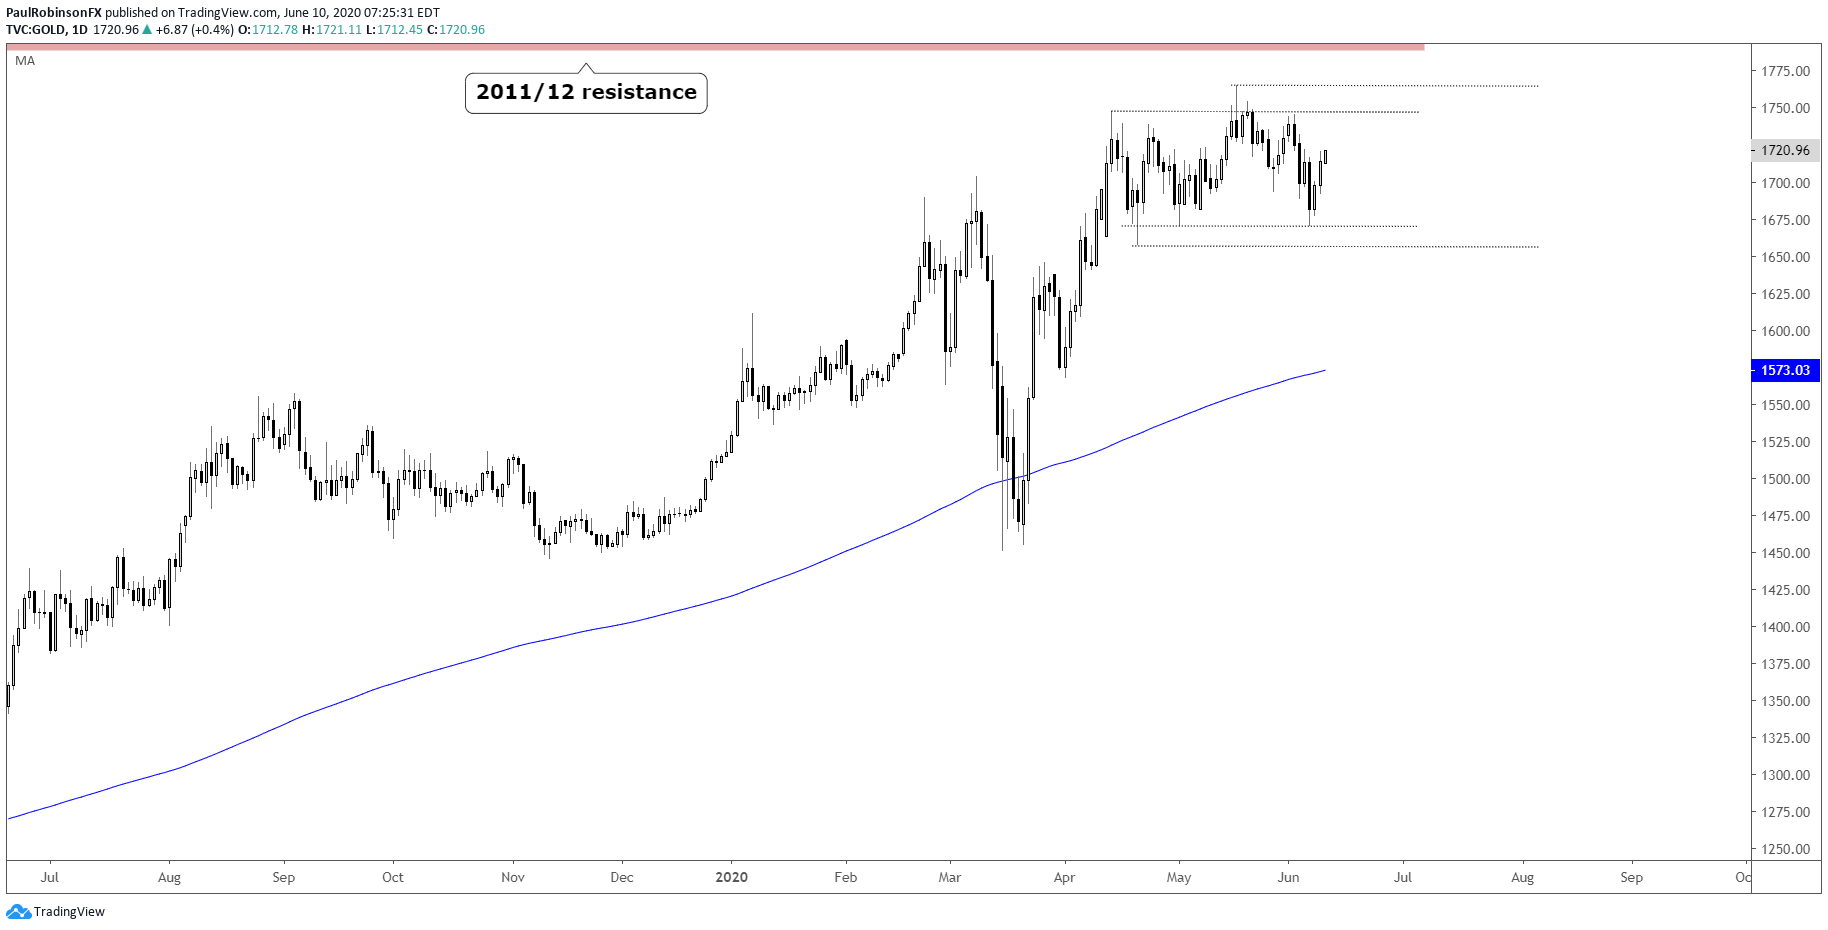
Gold Price Chart by TradingView
Resources for Forex Traders
Whether you are a new or experienced trader, we have several resources available to help you; indicator for tracking trader sentiment, quarterly trading forecasts, analytical and educational webinars held daily, trading guides to help you improve trading performance, and one specifically for those who are new to forex.
---Written by Paul Robinson, Market Analyst
You can follow Paul on Twitter at @PaulRobinsonFX


