


Gold Technical Price Outlook: XAU/USD Weekly Trade Levels
- Gold price updated technical trade levels - Weekly Chart
- XAU/USD breakout stalls at confluence uptrend resistance- rally at while below weekly open
- New to Gold Trading? Get started with this Free How to Trade Gold -Beginners Guide
Gold prices have remained subdued despite massive swings in risk appetite this week as growing concerns over the Coronavirus breakout and the oil price war continue to drive market sentiment. The yellow metal is down nearly 1% after registering fresh seven-year highs at multi-year trend resistance and the threat remains for a deeper pullback while below this technical threshold. These are the updated targets and invalidation levels that matter on the XAU/USD weekly chart. Review my latest Weekly Strategy Webinar for an in-depth breakdown of this gold trade setup and more.
Gold Price Chart - XAU/USD Weekly

Prepared by Michael Boutros, Technical Strategist; Gold on Tradingview
Notes: In my last Gold Weekly PriceOutlook we noted that XAU/USD, “remains at risk for exhaustion on the back of this week’s reversal off confluence uptrend resistance.” This zone has continued to cap the price rally on a close basis for the past three weeks despite a massive risk sell-off with momentum divergence into the highs further highlighting the threat of a larger pullback.
Initial weekly support rests at 1643 backed by the 61.8% retracement of the decline off the record highs at 1586. Broader bullish invalidation at 1522/26. A topside breach from here exposes the next major resistance confluence at 1733 backed by the 2012 high at 1795.

Bottom line: The gold price breakout has stalled at confluence uptrend resistance and while the broader outlook remains weighted to the topside, the immediate advance is vulnerable while below this threshold. From a trading standpoint, a good zone to reduce long-exposure / raise protective stops. Ultimately, a larger pullback may offer more favorable entries closer to uptrend support with a topside breach needed to mark resumption. Review my latest Gold Price Outlook for a closer look at the near-term XAU/USD technical trading levels.
For a complete breakdown of Michael’s trading strategy, review his Foundations of Technical Analysis series on Building a Trading Strategy
Gold Trader Sentiment – XAU/USD Price Chart
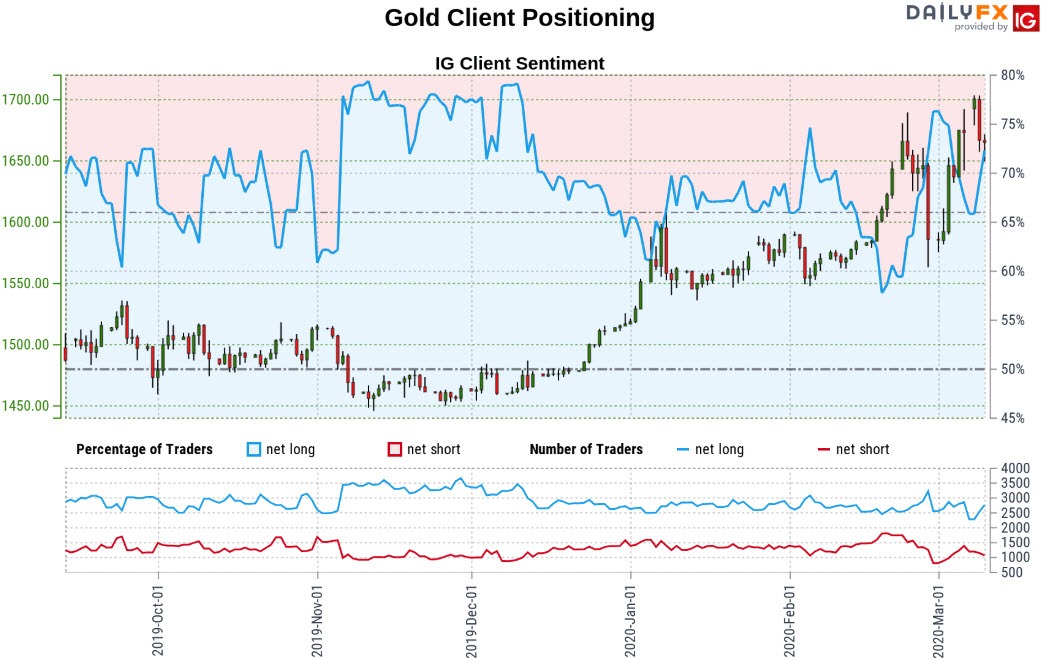
- A summary of IG Client Sentiment shows traders are net-long Gold- the ratio stands at +1.98 (66.45% of traders are long) – bearishreading
- Long positions are10.42% lower than yesterday and 16.19% lower from last week
- Short positions are20.35% higher than yesterday and 28.64% higher from last week
- We typically take a contrarian view to crowd sentiment, and the fact traders are net-long suggests Gold prices may continue to fall. Yet traders are less net-long than yesterday & compared with last week and recent changes in sentiment warn that the current Gold price trend may soon reverse higher despite the fact traders remain net-long.
| Change in | Longs | Shorts | OI |
| Daily | 1% | -3% | -1% |
| Weekly | 2% | -8% | -2% |
---
Previous Weekly Technical Charts
- Mexican Peso (USD/MXN)
- Euro (EUR/USD)
- US Dollar (DXY)
- British Pound (GBP/USD)
- Crude Oil (WTI)
- New Zealand Dollar (NZD/USD)
- Canadian Dollar (USD/CAD)
- Written by Michael Boutros, Currency Strategist with DailyFX
Follow Michael on Twitter @MBForex


