


Gold PriceTechnical Highlights:
- Gold boring as holidays quickly approach, but…
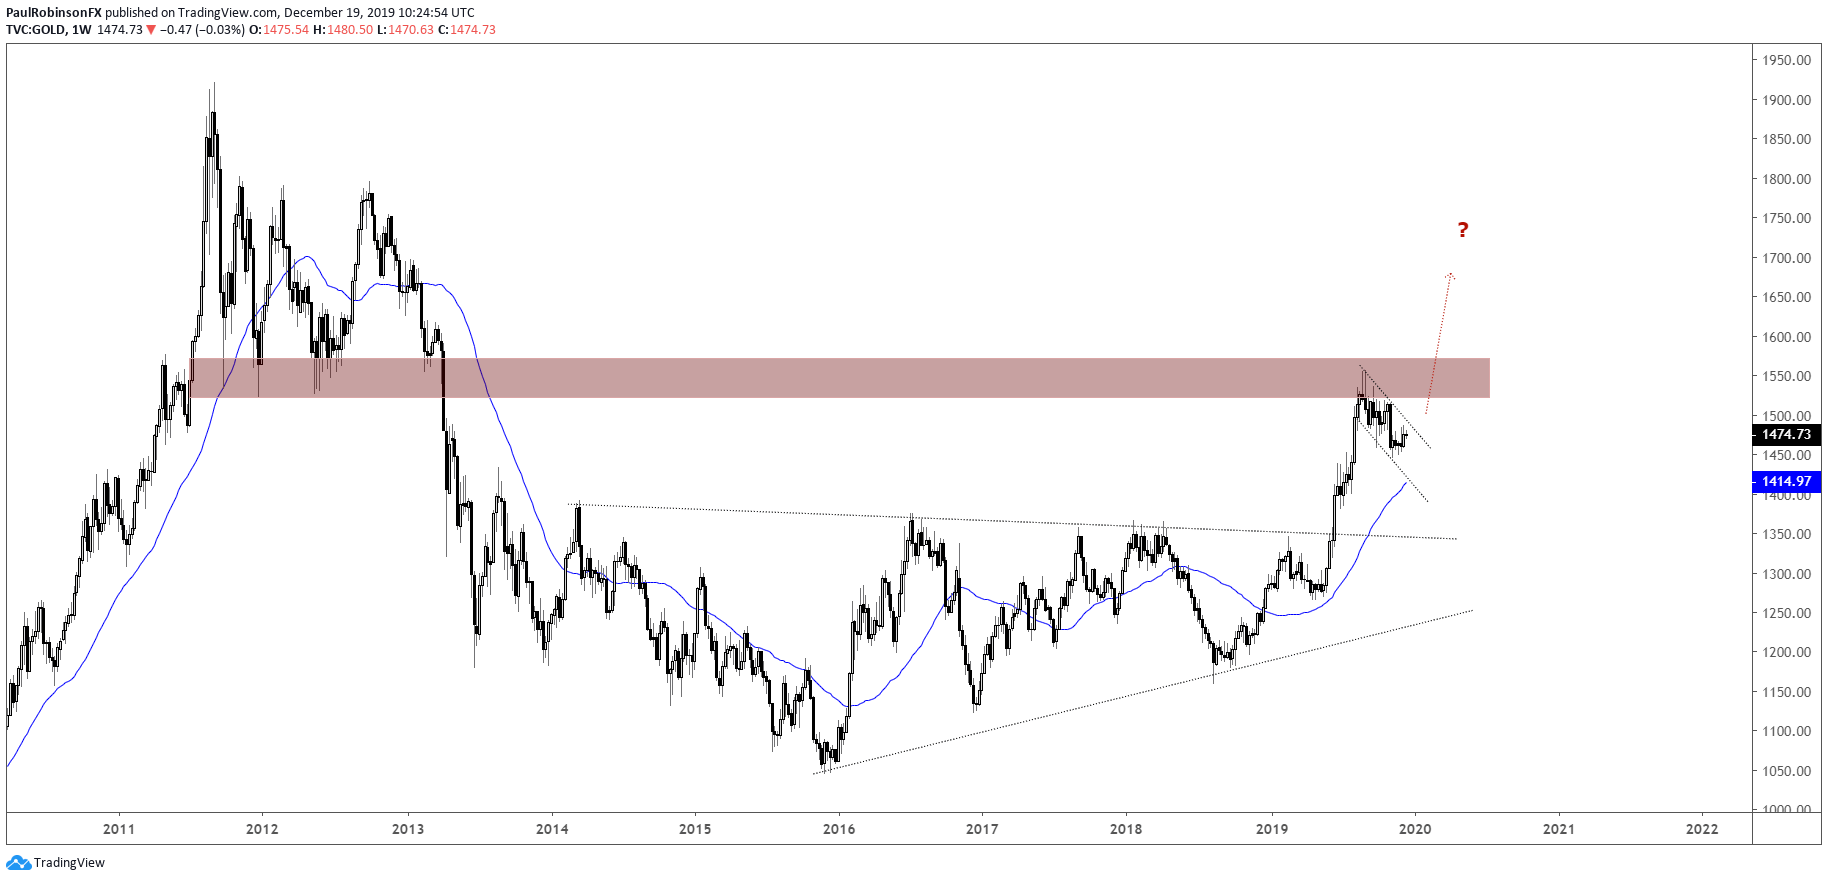
- Watch the bull-flag and 2011/12 levels in new year
Gold boring as holidays quickly approach, but…
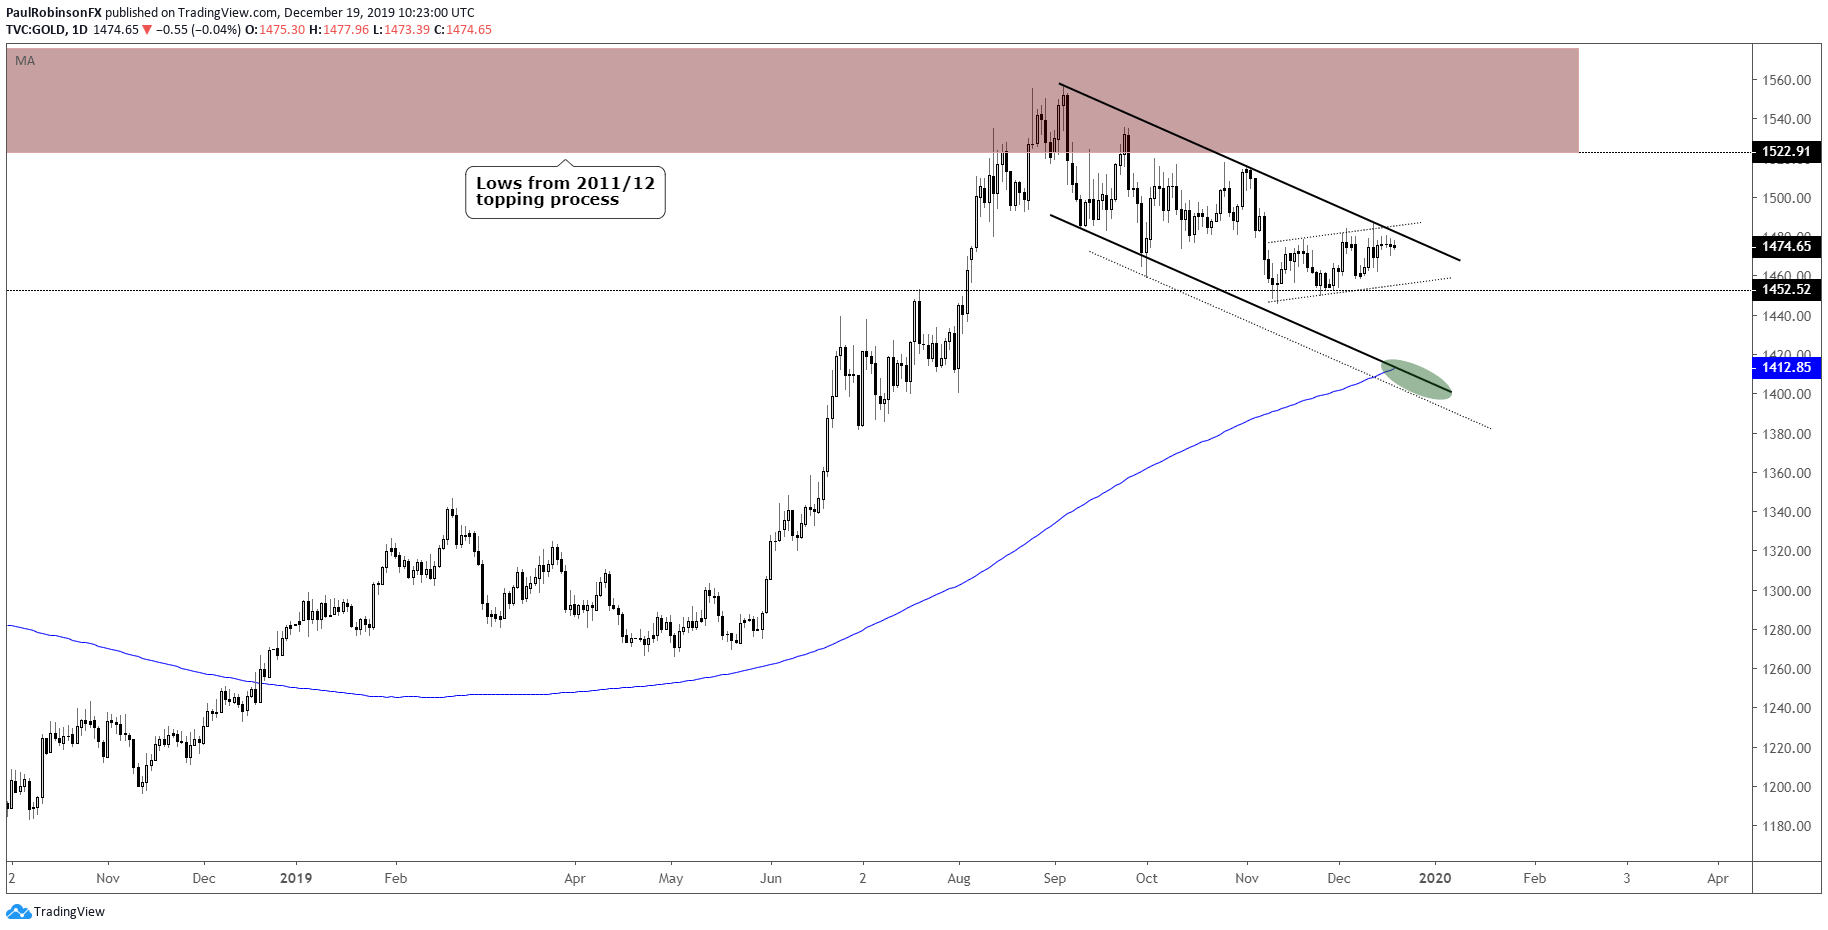
Gold hasn’t sparked much enthusiasm the past few weeks, seemingly gold traders began their end of year holiday early. This has the yellow bricks in near-term limbo, with a chance we see lower prices if resistance can’t be broken.
There may be some movement between now and the end of the year, but it is likely to be somewhat muted until full participation returns in January. The month-long channel structure off the November low has a bearish tilt to it at the moment. A break of the lower parallel will further along this bias.
A downside break won’t be a big bad omen for gold, not just yet at least. The downtrend since September continues to have the signs of a congestion pattern after the sprint higher during the middle of the year. A bull-flag pattern is coming into view and should lead to gold rallying at some point.
A breakout beyond the upper parallel of the pattern could come from around current levels or after another dive lower. Again, just waiting for a breakout to confirm, no need to speculate whether it will or won’t break the threshold. A breakout would soon have the long-term levels from 2011/12 in play up to ~1575, where after that point a much larger breakout could be underway.
A tagging of the 200-day and sharp reversal higher through the upper parallel looks like an ideal scenario, and with the near-term price action smacking of bearish this may indeed play out. But if not, that is fine too. For now, short-term traders will need to be patient and try and avoid getting chopped up. Once the calendar flips the cautious outlook may quickly change.
Trading Forecasts and Educational Guides for traders of all experience levels can be found on the DailyFX Trading Guides page.
Gold Price Weekly Chart (bull-flag continues below 2011/12 levels)
Gold price daily chart (channel inside bull-flag)
Gold Price Charts by TradingView
***Updates will be provided on the above technical outlook in webinars held at 1030 GMT on Tuesday and Friday. If you are looking for ideas and feedback on how to improve your overall approach to trading, join me on Thursday each week for the Becoming a Better Trader webinar series.
Resources for Forex & CFD Traders
Whether you are a new or experienced trader, we have several resources available to help you; indicator for tracking trader sentiment, quarterly trading forecasts, analytical and educational webinars held daily, trading guides to help you improve trading performance, and one specifically for those who are new to forex.
---Written by Paul Robinson, Market Analyst
You can follow Paul on Twitter at @PaulRobinsonFX


