


Gold Price & Silver Technical Highlights:
- Gold moving sideways, watch for bearish break inside bull-flag
- Silver bouncing after bear-flag break, still weak overall
Gold moving sideways, watch for bearish break inside bull-flag
Yesterday, gold came out of the gates hot but was then swatted lower on trade war headlines. This put in a bearish reversal day at trend-line resistance, or what is also the upper threshold of the bull-flag developing since the September high.
The generally sluggish nature of gold right now suggests that another leg lower could be next, especially with resistance having been tagged and abided by. To confirm this, looking for a break of the underside parallel of the channel developing since last month’s low.
A breakdown out of the congestion pattern could quickly have the underside of the broader bull-flag pattern in play along with the 200-day MA which is quickly coming into confluence; the area to watch is near the 1410-mark.
If, however, gold maintains the lower parallel and starts to run higher above the top-side line of the bull-flag and yesterday’s high at 1487 (and stay above), then a run towards testing the formidable levels from 2011/12 could be underway.
All-in-all, it looks like probability is skewed towards seeing a near-term move lower followed by an eventual breakout of the bull-flag. With that said, there are signposts to watch that will help confirm one of the above scenarios, so we don’t need to step too far out on a limb in speculating.

Gold Price Daily Chart (sluggish price action could lead lower inside bull-flag)
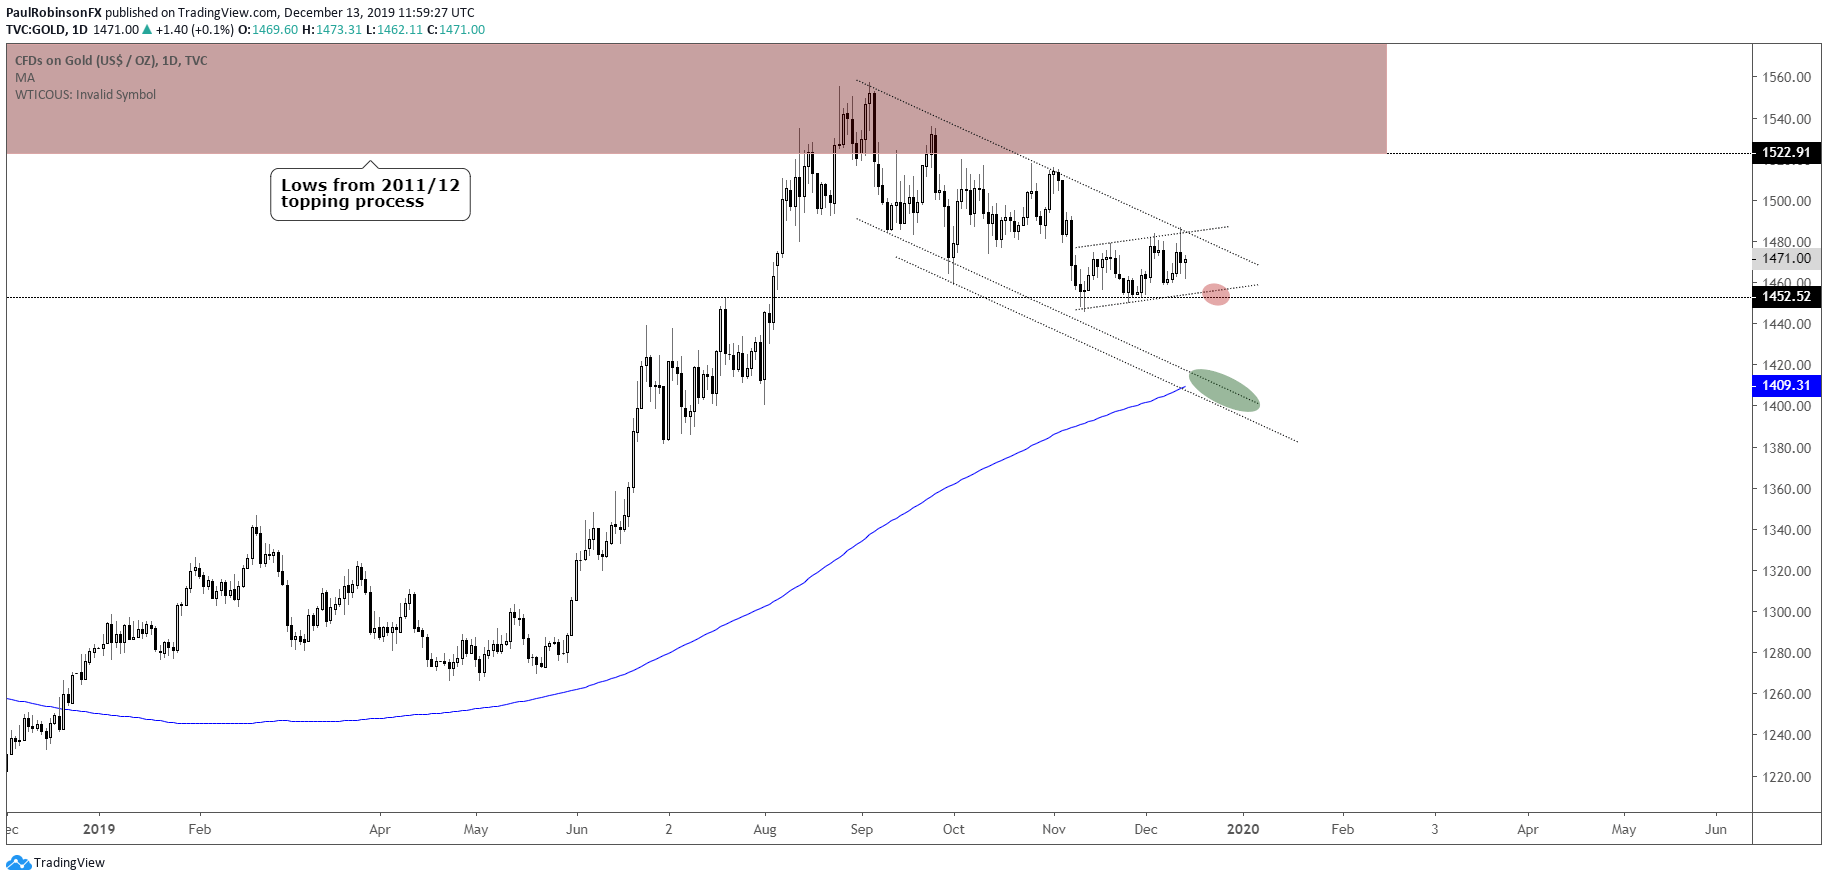
Gold Price Chart by TradingView
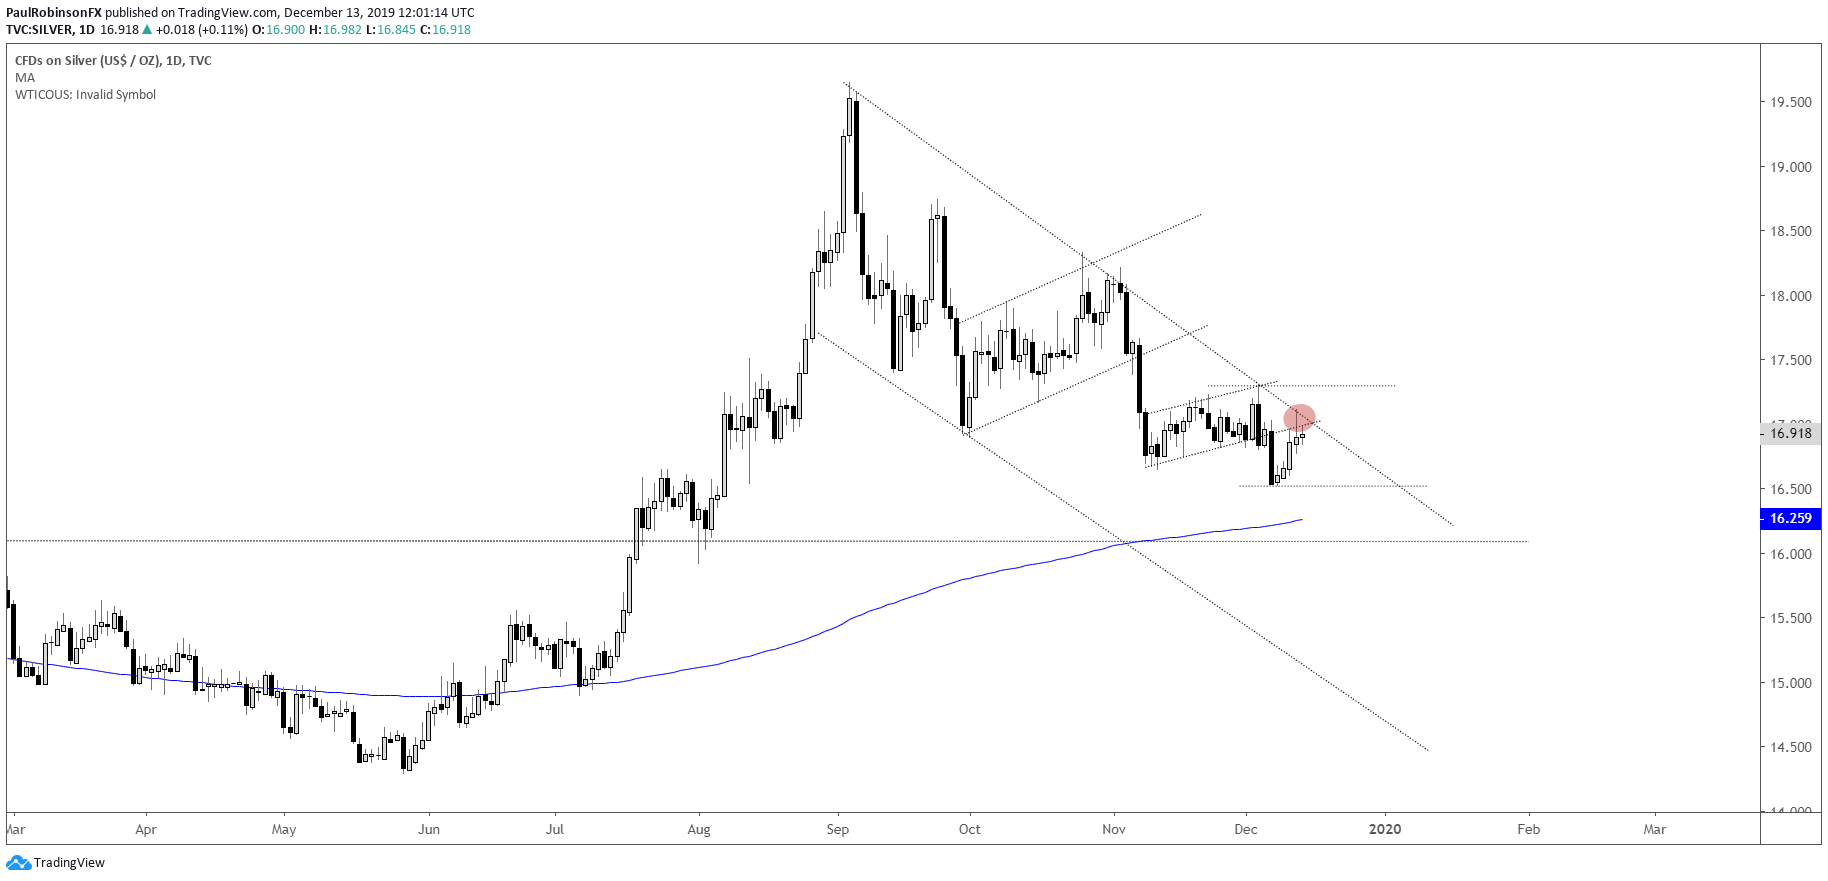
Silver broke down out of a bear-flag last week, but has since recovered. This doesn’t mean it was a false-break, a test here could be all that is in progress before moving lower again. Like gold, silver has a pesky trend-line keeping it pointed down.
Stay below the trend-line and the outlook remains bearish, with the 200-day and peaks from earlier in the year in play down around the 16.25/10-area. A breakout above the top-side trend-line and 17.29 will shift the bias towards seeing higher prices.
Silver Daily Chart (trend still lower, watch 200-day/trend-line)
***Updates will be provided on the above technical outlook in webinars held at 1030 GMT on Tuesday and Friday. If you are looking for ideas and feedback on how to improve your overall approach to trading, join me on Thursday each week for the Becoming a Better Trader webinar series.
Resources for Forex & CFD Traders
Whether you are a new or experienced trader, we have several resources available to help you; indicator for tracking trader sentiment, quarterly trading forecasts, analytical and educational webinars held daily, trading guides to help you improve trading performance, and one specifically for those who are new to forex.
---Written by Paul Robinson, Market Analyst
You can follow Paul on Twitter at @PaulRobinsonFX


