


Gold Prices Overview:
- It no longer appears that the gold price head and shoulders topping pattern is valid. Instead, a bullish continuation effort may be taking shape.
- Precious metals do well during periods of elevated volatility as increased uncertainty reduces the safe haven appeal of gold and silver. To this end, the 5-day correlation between GVZ and gold prices is 0.83, and the 20-day correlation is 0.73.
- Changes in retail trader positioning suggest that the current spot gold price trend may soon reverse higher despite the fact traders remain net-long.
Looking for longer-term forecasts on Gold and Silver prices? Check out the DailyFX Trading Guides.
Gyrations in global equity markets, sovereign bond yields, and FX markets have produced a caustic environment for precious metals. Sharp declines by gold prices at the end of September and Q3’19 were met with enthusiastic buying at the start of October, largely thanks to concerns over the state of global growth after weak PMI readings across the developed world.
But part of the reason why gold prices have been able to rebound in recent days has been the prospect that the Federal Reserve may need to accelerate its easing efforts as the US economy looks weaker and weaker. The past week’s data was incredibly discouraging: a 10-year low in US ISM Manufacturing; three-year lows in US ISM Services, CEO & CFO confidence; and a six-month low in US retail sales.
With uncertainty on the rise once again, the environment for precious metals is starting to become more appealing. In turn, as volatility rises, one of the two scenarios examined in the last gold price forecast may no longer be valid.
Gold Prices Weighed Down by Easing Gold Volatility
While other asset classes don’t like increased volatility (signaling greater uncertainty around cash flows, dividends, coupon payments, etc.), precious metals tend to benefit during periods of higher volatility. Heightened uncertainty in financial markets due to increasing macroeconomic tensions (like US-China trade war or the prospect of a no-deal, hard Brexit, for example) increases the safe haven appeal of gold and silver.
GVZ (Gold Volatility) Technical Analysis: Daily Price Chart (November 2016 to October 2019) (Chart 1)
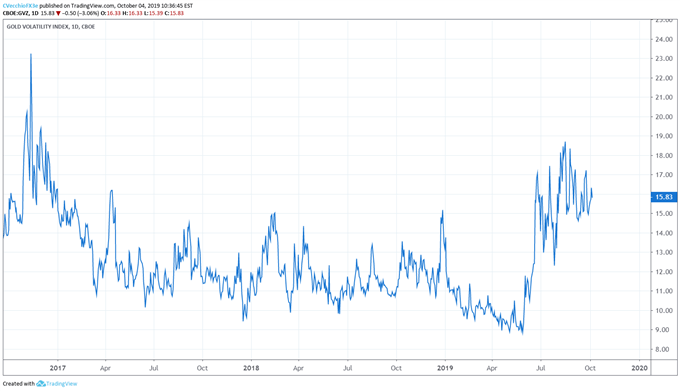
Gold volatility (as measured by the Cboe’s gold volatility ETF, GVZ, which tracks the 1-month implied volatility of gold as derived from the GLD option chain) has continued to trade sideways after its late-September spike, moving to 15.83 at the time of writing. Gold volatility levels remain below its 2019 high (and highest closing level since December 2017) set on August 15 at 18.72. The 5-day correlation between GVZ and gold prices is 0.83, and the 20-day correlation is 0.73; four weeks ago, on September 6, the 5-day correlation was 0.98 and the 20-day correlation was 0.37.
Gold Price Technical Analysis: Daily Chart - Bull Flag/Descending Channel (October 2018 to October 2019) (Chart 2)
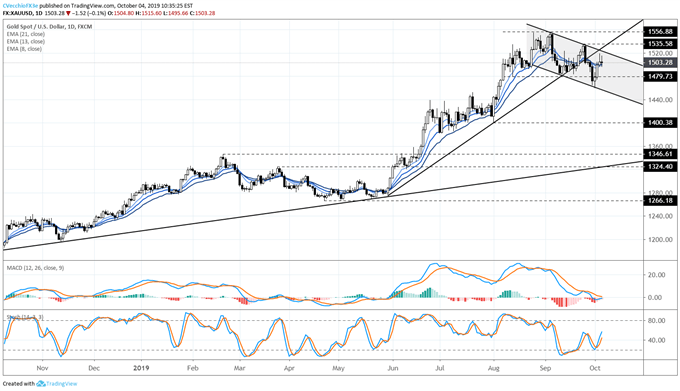
In our last gold price technical forecast updated, it was noted that “If gold prices are trading in a descending channel, then support may not be that far away. Measured from the September swing highs, the descending channel suggests support may around current prices, down to 1460 through the end of the week. If the descending channel support is respected, it may not be wise to take on such an aggressively bearish view: this could be a bull flag taking shape. If a bull flag is forming in gold prices, then more gains may be on the horizon through the end of 2019.”
Gold prices bottomed out this week at 1458.97 and returned above the prospective neckline of the short-term head and shoulders pattern at 1479.73. As a result, it appears that the alternative scenario’s topping effort is not a valid perspective.
Gold prices are back above the daily 8-, 13-, and 21-EMA envelope, which is neither in bullish nor bearish sequential order. Daily MACD is holding right at its signal line, while Slow Stochastics have trended higher into bullish territory. Accordingly, the bull flag perspective has become the focal point.
If the bull flag in gold prices is legitimate, a break above the late-September swing high at 1538.58 would need to be achieved. In doing so, gold prices would also retake the uptrend from the May and August 2019 lows. The 100% extension of the move from the May low, the September high, and the October low calls for a target price of 1726.31.
Gold Price Technical Analysis: Weekly Chart – Inverse Head and Shoulders Pattern (February to October 2019) (Chart 3)
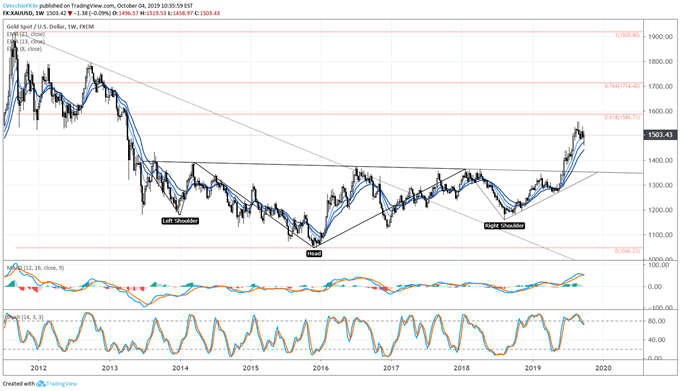
The longer-term gold price inverse head and shoulders pattern initiated in the first half of 2019 remains valid despite the potential for near-term weakness. The placement of the neckline determines the final upside targets in a potential long-term gold price rally: conservatively, drawing the neckline breakout against the January 2018 high at 1365.95 calls for a final target at 1685.67; aggressively, drawing the neckline breakout against the August 2013 high at 1433.61 calls for a final target at 1820.99. Only a break below the August 1 bullish outside engulfing bar low at 1400.38 would draw into question the longer-term bullish potential.
IG Client Sentiment Index: Spot Gold Price Forecast (October 4, 2019) (Chart 4)
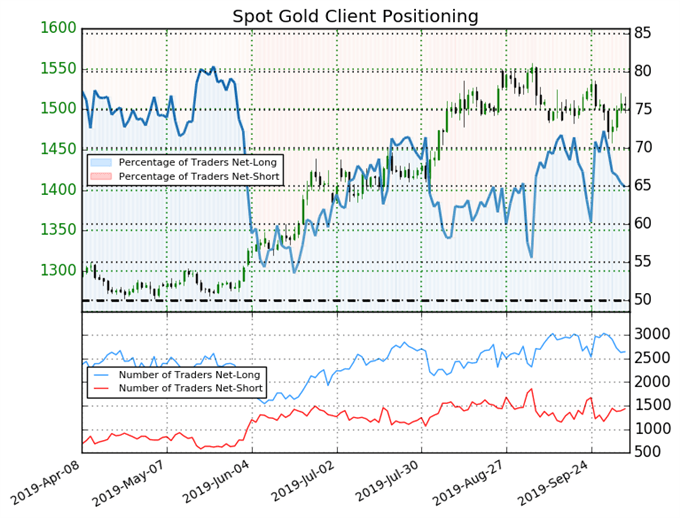
Spot gold: Retail trader data shows 64.8% of traders are net-long with the ratio of traders long to short at 1.84 to 1. The number of traders net-long is 10.3% lower than yesterday and 11.3% lower from last week, while the number of traders net-short is 1.6% lower than yesterday and 2.6% higher from last week.
We typically take a contrarian view to crowd sentiment, and the fact traders are net-long suggests spot gold prices may continue to fall. Yet traders are less net-long than yesterday and compared with last week. Recent changes in sentiment warn that the current spot gold price trend may soon reverse higher despite the fact traders remain net-long.
FX TRADING RESOURCES
Whether you are a new or experienced trader, DailyFX has multiple resources available to help you: an indicator for monitoring trader sentiment; quarterly trading forecasts; analytical and educational webinars held daily; trading guides to help you improve trading performance, and even one for those who are new to FX trading.
--- Written by Christopher Vecchio, CFA, Senior Currency Strategist
To contact Christopher Vecchio, e-mail at cvecchio@dailyfx.com
Follow him on Twitter at @CVecchioFX
View our long-term forecasts with the DailyFX Trading Guides


