


- Gold reverses from former uptrend support– near-term risk is lower sub-1302
- Check out our 2019 projections in our Free DailyFX Gold Trading Forecasts
- Join Michael for Live Weekly Strategy Webinars on Mondays at 12:30GMT
Gold prices reversed just ahead of monthly open resistance after posting two equal legs higher and leaves the risk for further losses. These are the updated targets and invalidation levels that matter on the XAU/USD charts into the close of the week.
New to Gold Trading? Get started with this Free How to Trade Gold -Beginners Guide
Gold Daily Price Chart (XAU/USD)
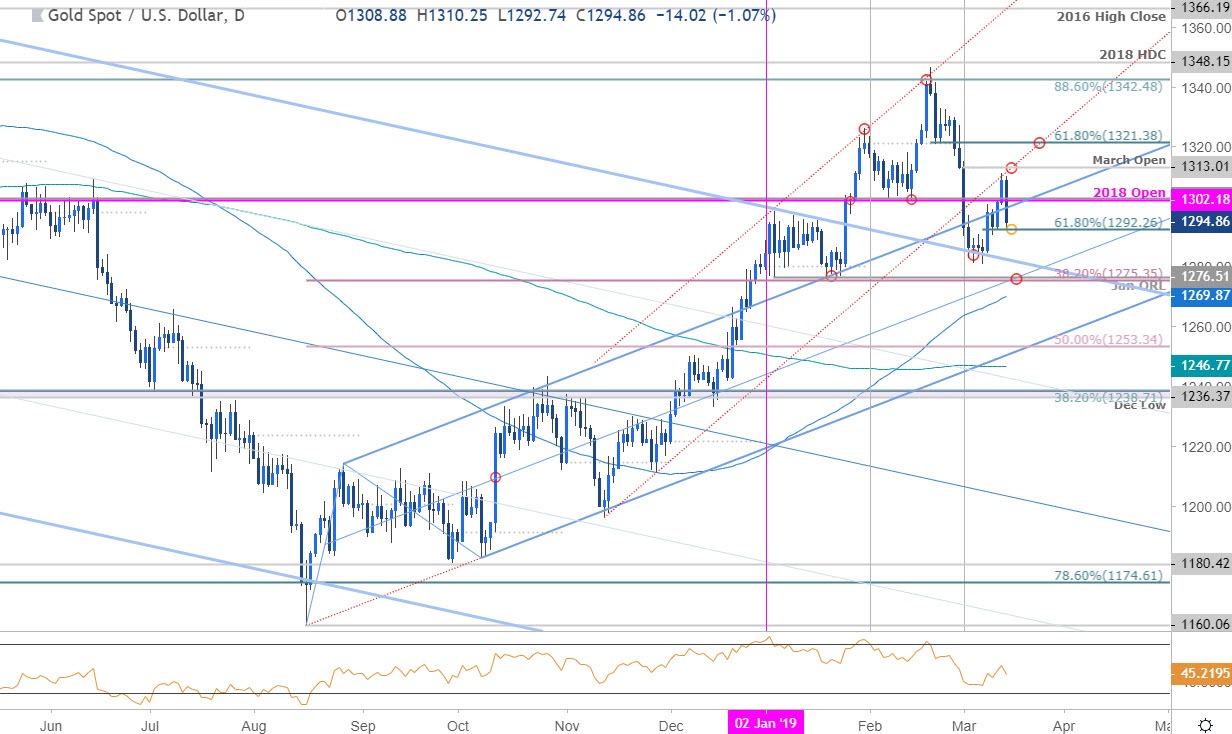
Technical Outlook: In my last Gold Technical Outlook we noted that the price correction was testing slope support with more, more significantzone eyed,“just lower at 1275/76 – a region defined by the 38.2% retracement of the August rally and the objective 2019 opening-range low.” Gold registered a low at 1280 with price respecting slope on a close basis before recovering higher. The advance failed this week at former channel support, turned resistance, with the subsequent sell-off breaking back below the 1302 pivot zone.
The decline is now testing the 61.8% retracement of the advance at 1292 and a break below this threshold would risk another test of slope support with broader bullish invalidation steady at 1275/76 where the yearly opening-range low converges on the 38.2% retracement. Ultimately, a topside breach above monthly open resistance at 1313 is needed to shift the focus higher targeting the 61.8% retracement at 1321.
Why does the average trader lose? Avoid these Mistakes in your trading
Gold 120min Price Chart (XAU/USD)

Notes: A closer look at price action shows gold breaking below a near-term ascending channel formation extending off the monthly lows. The risk is lower sub-1302 with a break lower targeting the median-line around ~1285 backed by yearly open support at 1280 and 1275/76 – both levels of interest for possible exhaustion / long-entries IF reached.
Learn how to Trade with Confidence in our Free Trading Guide
Bottom line: The immediate risk is lower while below 1302 but ultimately, we’re looking for a new low to satisfy a larger correction. From a trading standpoint, a good place to reduce short exposure / lower protective stops. We’ll be on the lookout for a possible fade opportunity closer to the yearly open / slope support.
For a complete breakdown of Michael’s trading strategy, review his Foundations of Technical Analysis series on Building a Trading Strategy
Gold Trader Sentiment
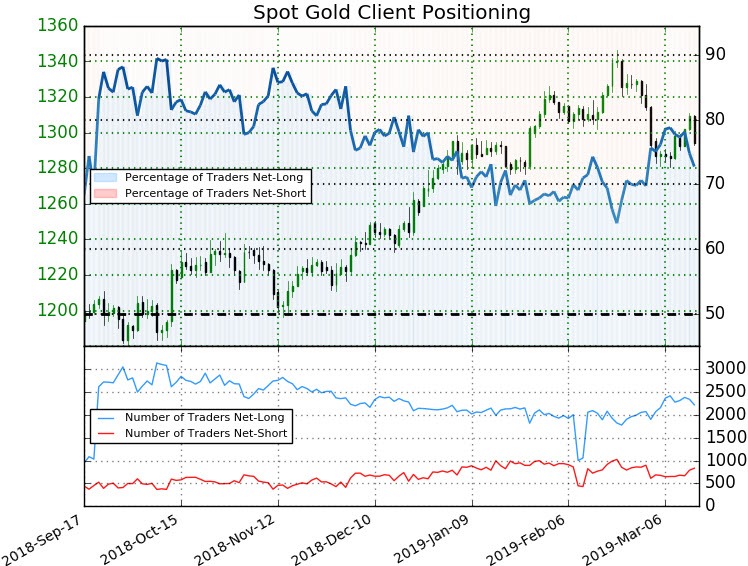
- A summary of IG Client Sentiment shows traders are net-long Gold- the ratio stands at +2.67 (72.7% of traders are long) – bearishreading
- Long positions are11.2% lower than yesterday and 6.1% lower from last week
- Short positions are 14.1% higher than yesterday and 21.7% higher from last week
- We typically take a contrarian view to crowd sentiment, and the fact traders are net-long suggests Gold prices may continue to fall. Yet traders are less net-long than yesterday and compared with last week. Recent changes in sentiment warn that the current Gold price trend may soon reverse higher despite the fact traders remain net-long.
See how shifts in Gold retail positioning are impacting trend- Learn more about sentiment!
---
Active Trade Setups
- British Pound Price Outlook: Brexit Game Plan Targets Sterling Range
- NZD/USD Technical Price Outlook: Kiwi Consolidation Narrows
- Australian Dollar Price Outlook: AUD/USD Recovery Faces First Test
- Canadian Dollar Price Outlook: USD/CAD Fails at Monthly Range Highs
- EUR/USD Price Outlook: Euro Back Above 1.13 – Bull Trap or Breakout?
- Written by Michael Boutros, Currency Strategist with DailyFX
Follow Michael on Twitter @MBForex


