


- Gold prices set weekly / monthly opening range below critical resistance- constructive above 1206
- Check out our 3Q projections in our Free DailyFX Gold Trading Forecasts
- Join Michael for Live Weekly Strategy Webinars on Mondays at 12:30GMT
Gold has rallied more than 1% month-to-date with prices setting a well-defined weekly / monthly opening-range just below a critical resistance zone we’ve been tracking for months now. These are the updated targets and invalidation levels that matter on the XAU/USD charts. Review this week’s Strategy Webinar for an in-depth breakdown of this setup and more.
New to Gold Trading? Get started with this Free How to Trade Gold -Beginners Guide
Gold Daily Price Chart (XAU/USD)
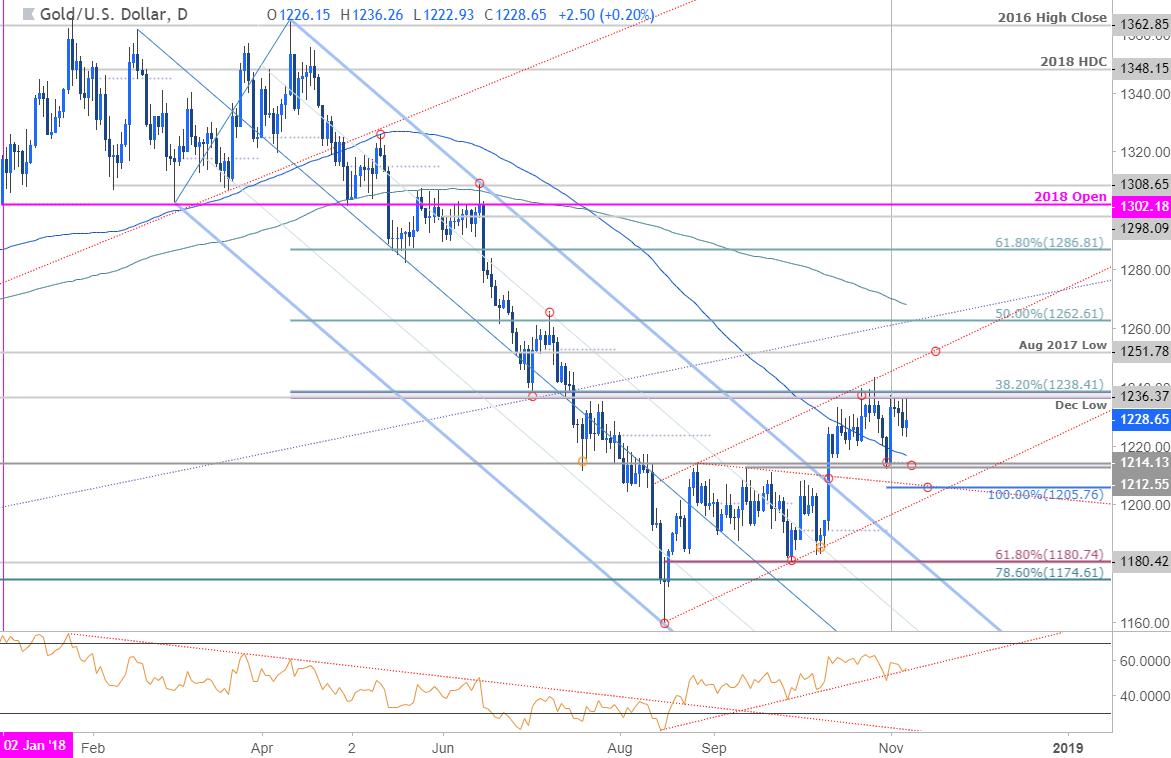
Technical Outlook: In our latest Gold Weekly Technical Outlook our ‘bottom line’ noted that the, “immediate advance remains vulnerable sub-1238 but ultimately, a breach is favored. Note that price has already set an impressive November opening-range between well-defined technical levels with the focus on a break of the 1210-1238 zone for guidance.” Gold has continued to hold below key resistance at 1236/38-a region defined by the December lows and the 38.2% retracement of the yearly range. A breach / close above this threshold is needed to fuel the next ‘leg’ higher in price targeting channel resistance / August 2017 low at 1252 backed by the 50% retracement at 1263.
A key support pivot rests at 1212/14- note that the monthly open also converges on this zone and further highlights the technical significance of this threshold. Broader bullish invitation lowered to the 100% extension of the late-October decline which converges on the lower parallel at 1206.
Why does the average trader lose? Avoid these Mistakes in your trading
Gold 240min Price Chart (XAU/USD)

Notes: A closer look at price action sees gold setting its weekly opening-range just below key resistance at 1236/38 with the median-line of the October pitchfork offering support yesterday. A break below the 61.8% retracement at 1222 would risk a larger pullback targeting 1212/14 with 1208 & 1206 representing levels of interest for possible exhaustion / long-entries IF reached.
Learn how to Trade with Confidence in our Free Trading Guide
Bottom line: While the broader outlook for Gold remains constructive, the immediate advance is still vulnerable while below 1238 and we’re looking for a break of the weekly opening-range for guidance. From a trading standpoint, I’ll favor fading weakness into the lower parallels targeting a topside breach of this key resistance zone. Keep in mind the FOMC interest rate decision is on tap tomorrow and could fuel added volatility in price- stay nimble.
For a complete breakdown of Michael’s trading strategy, review his Foundations of Technical Analysis series on Building a Trading Strategy
Gold Trader Sentiment
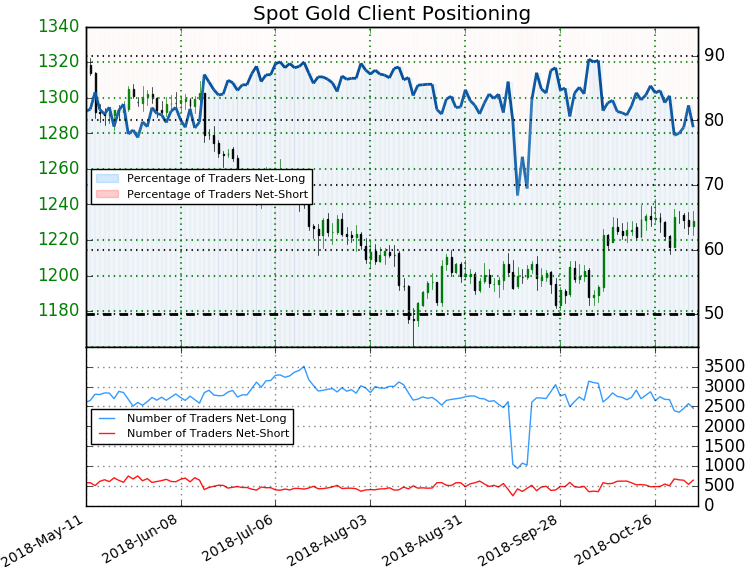
- A summary of IG Client Sentiment shows traders are net-long Gold - the ratio stands at +3.75 (79.0% of traders are long) – bearishreading
- Long positions are3.2% lower than yesterday and 7.1% lower from last week
- Short positions are 0.5% lower than yesterday and 20.0% higher from last week
- We typically take a contrarian view to crowd sentiment, and the fact traders are net-long suggests Gold prices may continue to fall. Yet traders are less net-long than yesterday and compared with last week and the recent changes in sentiment warn that the current Gold price trend may soon reverse higher despite the fact traders remain net-long.
See how shifts in Gold retail positioning are impacting trend- Learn more about sentiment!
---
Active Trade Setups
- EUR/USD Price Outlook: Euro Battle Lines Drawn ahead of FOMC
- USD/CAD Price Outlook: Key Resistance Holds into the October Close
- NZD/USD Price Outlook: Kiwi Carries Breakout Potential
- Written by Michael Boutros, Currency Strategist with DailyFX
Follow Michael on Twitter @MBForex or contact him at mboutros@dailyfx.com


