


Talking Points:
- Gold prices have been rather one-sided since the Fed’s last rate hike.
- Retail traders are still on the long side of Gold, which may be indicating a deeper pullback before that bigger-picture bullish trend is ready for resumption.
- Are you looking to improve your trading approach? Check out Traits of Successful Traders. And if you’re looking for an introductory primer to the Forex market, check out our New to FX Guide.
To receive James Stanley’s Analysis directly via email, please sign up here
Gold Prices Rally to Fresh Yearly Highs
Gold prices have been in the midst of an intense winning streak since mid-December, which was right around the time the Federal Reserve last hiked rates. Gold prices had set a bit of support just above the $1,236 level just ahead of that rate hike, but by the end of the month and year, prices had already climbed above the $1,300 psychological level. As 2018 opened with another gust of USD-weakness, this helped to further propel Gold prices up to a fresh yearly high, fast approaching the key level at $1,375 that currently marks the 3.5 year high watermark for Gold prices.
Gold Prices Begin Pulling Back After Setting Fresh Highs Last Week
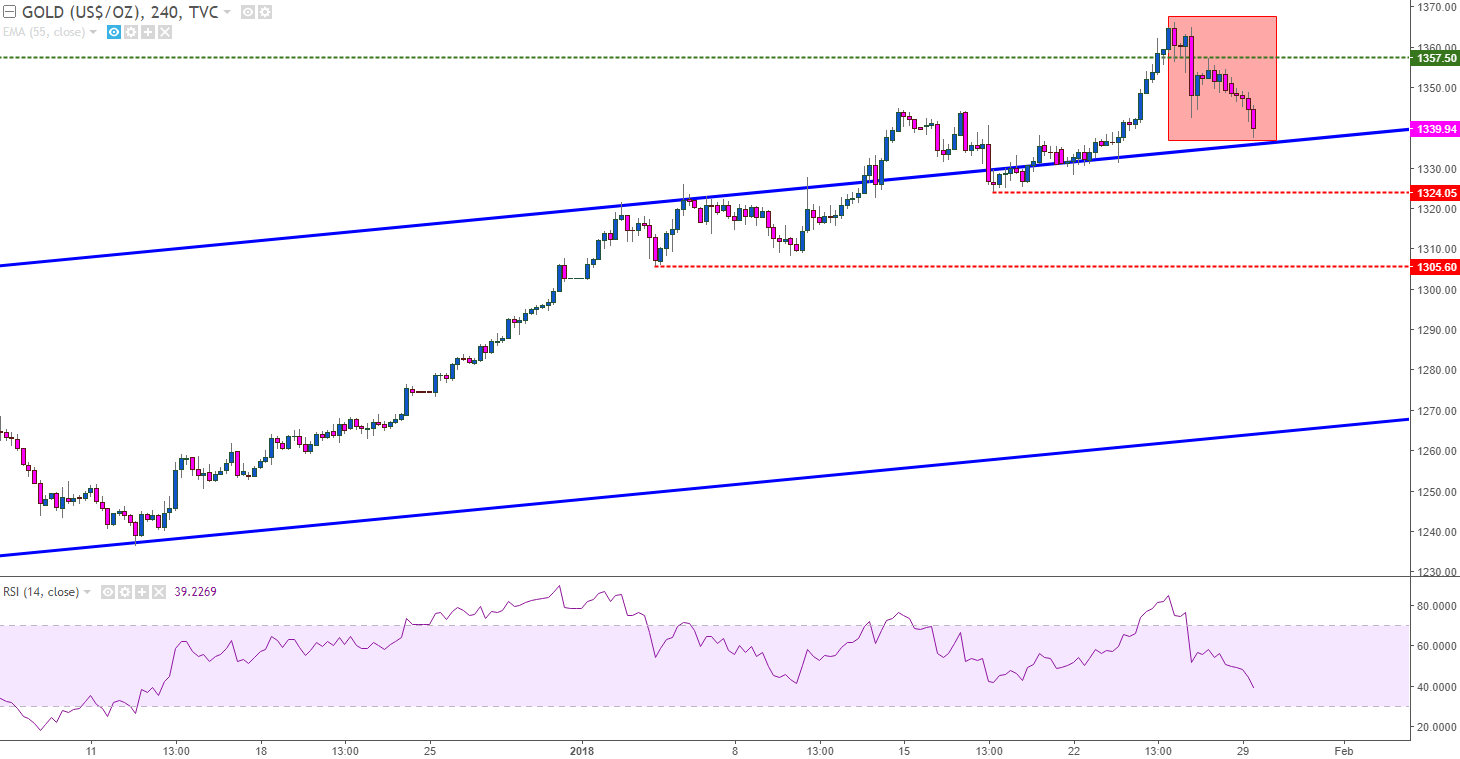
Chart prepared by James Stanley
To help put this recent move of strength in scope of the bigger picture, we’re looking at the weekly chart below, with prices continuing to trade in a bullish channel that’s been in play since the reversal that started last year, and re-energized in December around that last rate hike from the Fed.
Gold Prices Weekly Chart: Bullish Channel Continues Towards 3.5 Year Highs
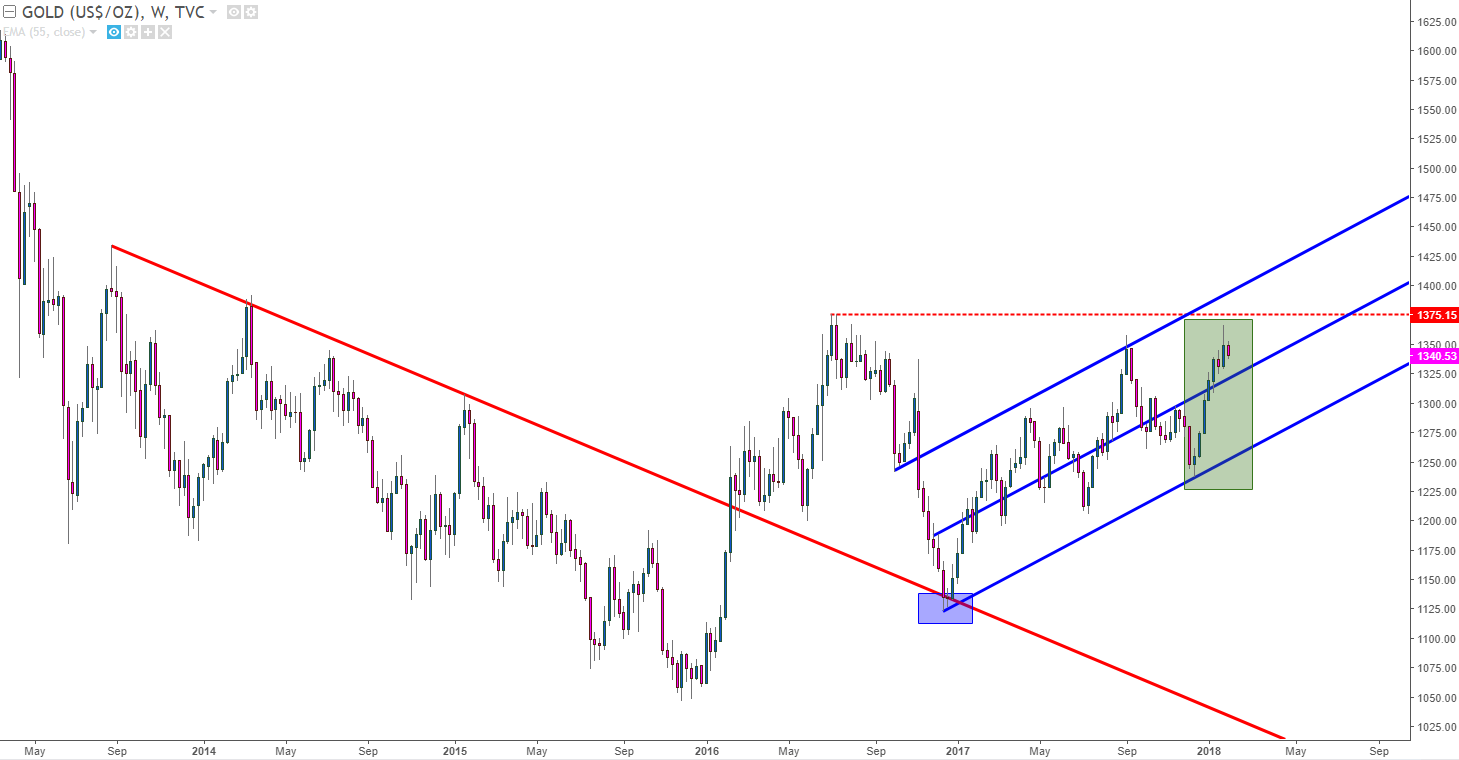
Chart prepared by James Stanley
So, while price action in Gold has been extremely bullish since the Fed’s last rate hike in December, traders would want to move forward with a fair bit of caution given longer-term support/resistance levels in Gold prices.
A Big Week of Data Awaits with a Heavy U.S. Focus
The big bullish run in Gold has very much went hand-in-hand with a continuation of the bearish move in the U.S. Dollar. As the Dollar sell-off that started last year has continued, Gold prices have tacked on deeper gains. This makes for a rather clear relationship in the near-term, so for those looking at bullish plays in Gold, acceptance of risk in the short-side of the Dollar is a near necessity, and that’s where the complication lies with our current backdrop.
The U.S. Dollar hastened its sell-off last week on comments from U.S. Treasury Secretary Steven Mnuchin. Those comments were later walked back and in-large part refuted by President Trump, and since then we’ve seen a bit of that weakness get priced-out of the market. The bigger question is whether there is more weakness to price-out and whether that aggressive bearish trend in the U.S. Dollar might be ready to continue, even with its deeply oversold state showing last week. Complicating matters is the fact that this week brings a plethora of U.S. data points.
For those looking at bullish plays in Gold, waiting for a pullback could be the most prudent way of approaching the matter. On the four-hour chart below, we’re looking at two potential support levels based on recent price action above $1,296, which had helped to form a double top in the first half of last year. Support developing on the four-hour or daily charts at either of these potential supports opens the door for top-side continuation plays.
Gold Four-Hour Chart with Potential Supports Applied

Chart prepared by James Stanley
To read more:
Are you looking for longer-term analysis on Gold prices? Our DailyFX Forecasts for Q1 have a section specifically for Gold. We also offer a plethora of resources on our Gold page, and traders can stay up with near-term positioning via our IG Client Sentiment Indicator.
Chart prepared by James Stanley
--- Written by James Stanley, Strategist for DailyFX.com
To receive James Stanley’s analysis directly via email, please SIGN UP HERE
Contact and follow James on Twitter: @JStanleyFX


