


To receive James Stanley’s Analysis directly via email, please sign up here.
- Gold Technical Strategy: Near-term: Aggressively bearish.
- Gold prices have been in retreat over the past week as odds for a March rate hike from the Fed have flown-higher.
- If you’re looking for trading ideas, check out our Trading Guides. They’re free and updated for Q1, 2017. If you’re looking for ideas more short-term in nature, please check out our Speculative Sentiment Index Indicator (SSI).
In our last article, we asked if bulls in the Gold market were in the early process of retreat. At the time, rate hike expectations for the United States were steadily increasing for the upcoming March meeting, taking place next Wednesday. Previously, it didn’t’ appear as though Gold prices were buying the Fed’s rate hike plans. But as various members of the bank got more vociferous on the subject of rate hikes, starting with John Williams of the San Francisco Fed just hours before Donald Trump’s Joint Address to the Union; and it appears as though the Gold market has awoken to the reality of a persistently hawkish Fed. We pointed out a prior level of support at $1,250, which was the same level that came-in as support on the night of Brexit; as potential resistance for short-term momentum.
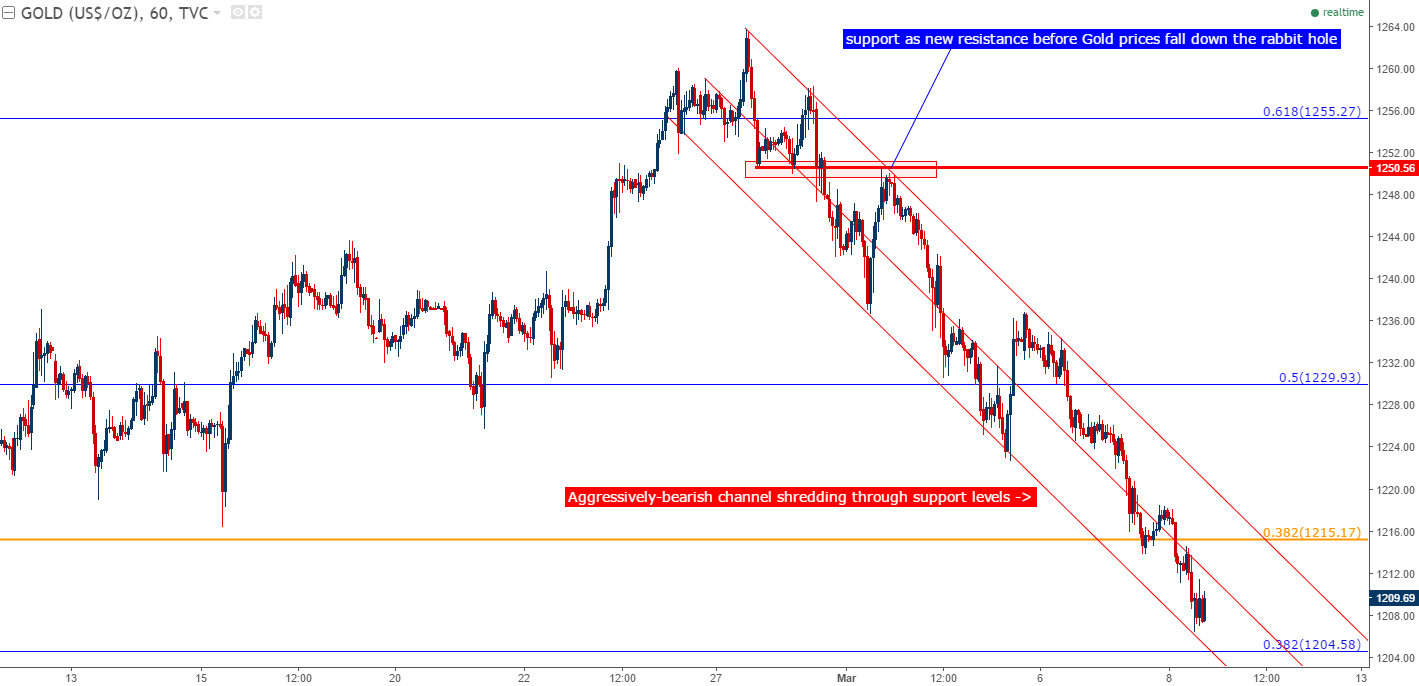
Chart prepared by James Stanley
Since then, Gold prices have gotten crushed; moving from a swing-high above $1,250 just a week ago to below $1,210 as of this writing to tally a total move of -3.3% in a single week. To be sure, there is prime motivation for such a theme which is likely why we’ve seen such little respect of support as Gold prices have been on the way down. With a key Fed meeting next week in which the world may get just the 3rd rate hike from the bank in the past 10 years, the table is set for a continuation of USD-strength and few traders have wanted to stand in the way of the move-lower in Gold prices.
So there is legitimate continuation potential here for further bearish momentum. For traders looking to gain such exposure, resistance at the $1,215.17 area could be extremely attractive for such a scenario. This is the 38.2% Fibonacci retracement of the 2013-2015 major move in Gold prices, but perhaps more importantly this level has come as pertinent to price action over the past few months.

Chart prepared by James Stanley
Support could be a challenge here given that prices have been dropping like they’re attached to an anvil. $1,200.51 is a big level as the 38.2% retracement of the ‘big picture’ move in Gold prices, taking the Bretton Woods fix of $35/oz up to the 2011 high at $1,920. This had also offered some support to price action’s bullish move last year; but given that this is just $10 away from current price, it could be difficult to imagine all of this bearish momentum coming to a standstill as soon as $1,200 comes into-play. But below $1,200 are a series of interesting levels that traders can investigate for those next potential iterations of support. Please note that these levels have been ‘widened-out’ to account for next week’s abundance of drivers, which can keep price action in Gold volatile in the near-term.
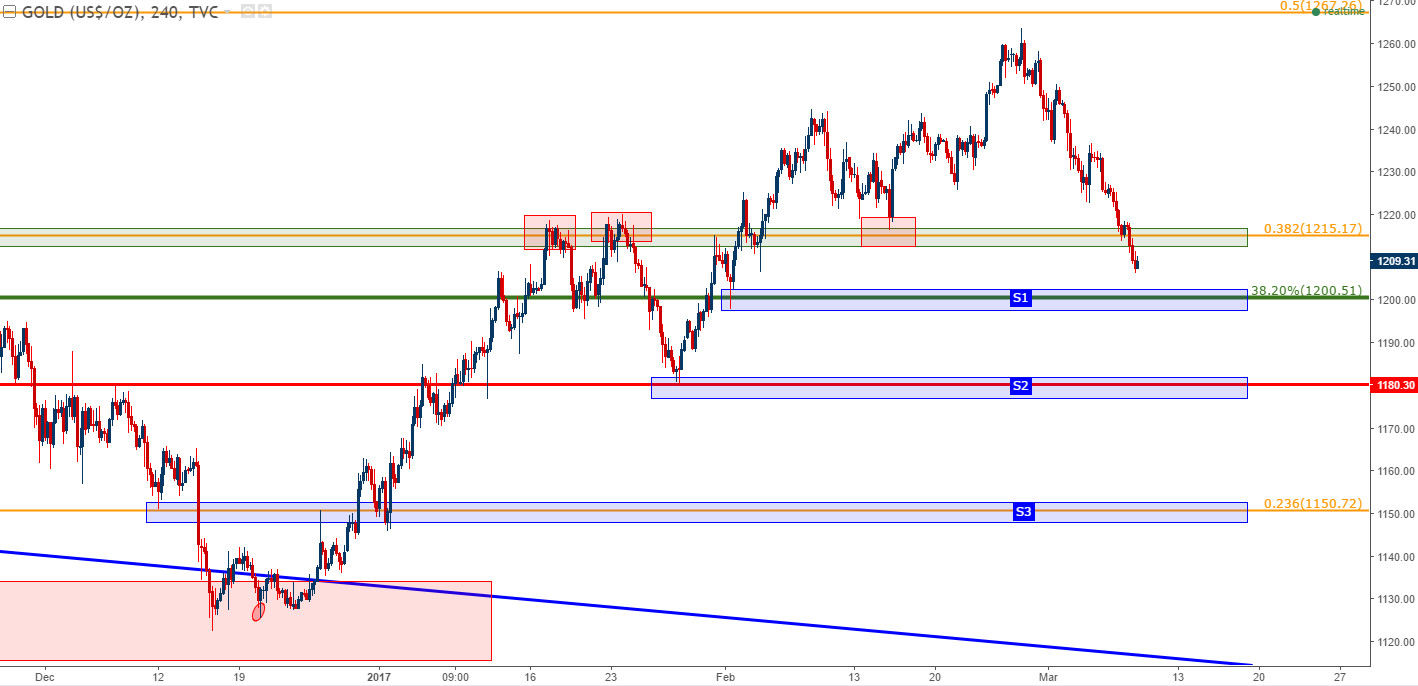
Chart prepared by James Stanley
--- Written by James Stanley, Strategist for DailyFX.com
To receive James Stanley’s analysis directly via email, please SIGN UP HERE
Contact and follow James on Twitter: @JStanleyFX


