


To receive James Stanley’s Analysis directly via email, please sign up here.
Talking Points:
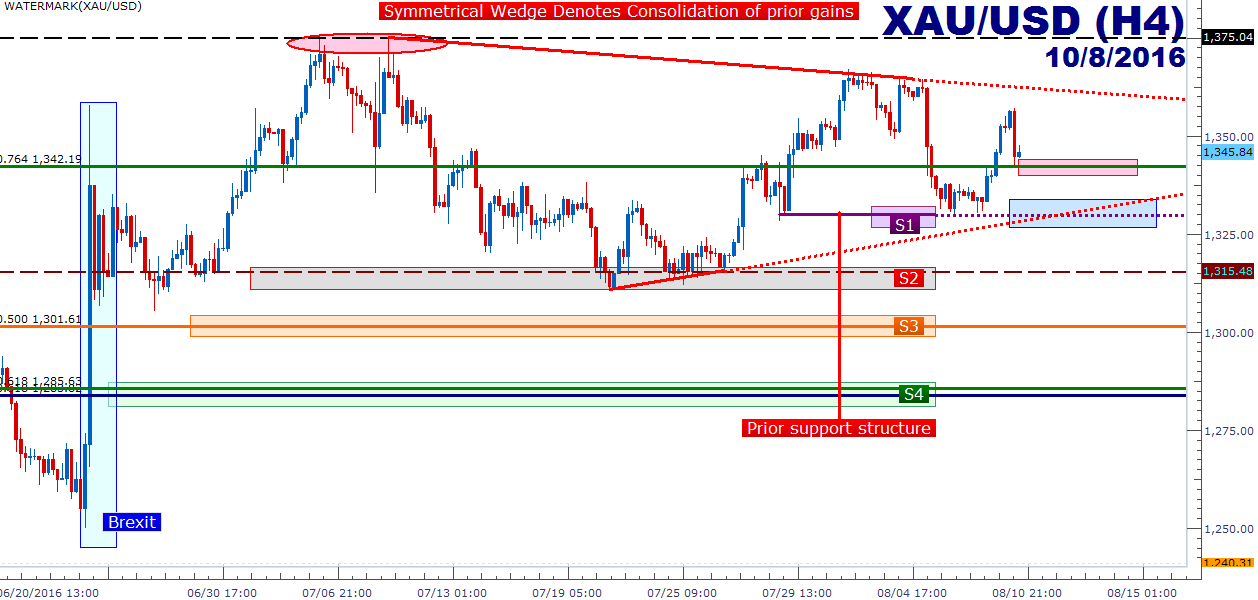
- Gold Technical Strategy: Bullish trend continues with price action consolidating in a symmetrical-wedge near multi-year highs.
- Gold prices have been volatile over the last week around major-USD themes driven by FOMC, GDP and then NFP.
- If you’re looking for trading ideas, check out our Trading Guides. And if you want something more short-term in nature, check out our SSI indicator.
In our last article, we looked at the retracement in the up-trend in Gold prices just ahead of the Bank of England rate decision. And while the BOE unrolled a bazooka of stimulus, it was the NFP report a day later that really hit Gold prices. After a blowout print for U.S. jobs in the month of July, the Dollar strengthened significantly and this pulled Gold prices down to deeper levels of support.
That move of weakness in Gold prices continued through the open this week until a short-term ‘higher-low’ was established around the $1,330-area of the chart. We had discussed this level shortly after the weekly open, and thus far that support has held as price action ratcheted back above the key Fibonacci level at $1,342.19, which is the 76.4% retracement of the 3-year move in Gold prices, taking the high from August 2013 to the low in December of 2015.
The longer-term formation still denotes the prospect of continued bullishness in Gold prices, albeit with the build of a symmetrical wedge formation as defined by both lower-highs and higher-lows over the past month-and-a-half (shown on the below chart in red). This element of consolidation ‘fits’ with the current macro landscape that has volatile expectations around Fed policy as the next FOMC meeting is more than a month away. This could present an environment devoid of the typical driver of bullish-movements in Gold prices (dovish Central Bank innuendo), and traders may want to moderate bullishness to look for a deeper support level.
The most recent support-swing took place in the $1,330-vicinity, and this coincides with a projected trend-line that forms the bottom of that symmetrical wedge formation. Should support show near this region, top-side plays in Gold could become attractive.
Created with Marketscope/Trading Station II; prepared by James Stanley
--- Written by James Stanley, Analyst for DailyFX.com
To receive James Stanley’s analysis directly via email, please SIGN UP HERE
Contact and follow James on Twitter: @JStanleyFX


