


To receive James Stanley’s Analysis directly via email, please sign up here.
Talking Points:
- Gold Technical Strategy: Bullish trend continues with price action near intermediate-term highs.
- Gold prices have seen a near-term moderation of the up-trend, with price action moving down to short-term support.
- If you’re looking for trading ideas, check out our Trading Guides. And if you want something more short-term in nature, check out our SSI indicator.
In our last article, we looked at the continued up-trend in Gold as price action was attempting to carve out ‘higher-low’ support in front of the most recent FOMC rate decision. At the time of publishing, prices were working with the mass of support in the zone around the $1,315-neighborhood; but fears of a hawkish Fed in response to fresh all-time highs in equity prices kept price action subdued leading into the announcement. But when that statement came-out with only slight tweaks to the language, markets began to build-in the expectation for continued dovishness, under the premise that the Fed would likely continue to do what they’ve been doing (providing dovish support for global risk markets).
This was helpful for Gold prices, as price action shot up to resistance at $1,342 in short order; but it was the U.S. GDP announcement just two days later that really substantiated the trend. U.S. GDP came in far under expectations, further driving that hope for more dovish support from the Fed under the logic that the Federal Reserve likely wouldn’t be hiking rates in the face of slowing data.
Since then, we’ve seen extension of the up-trend in Gold prices with multiple iterations of higher-highs and higher-lows showing. As of now, price action in Gold is showing at an interesting level of potential support. The price of $1,354.87 is the swing-high that came into the market on the heels of that GDP announcement, and now this older form of resistance is showing at potential support. And also of interest is a trend-line projection that’s provided multiple intra-day support/resistance inflections since mid-July as the trend has re-emerged to the up-side (shown in purple below).
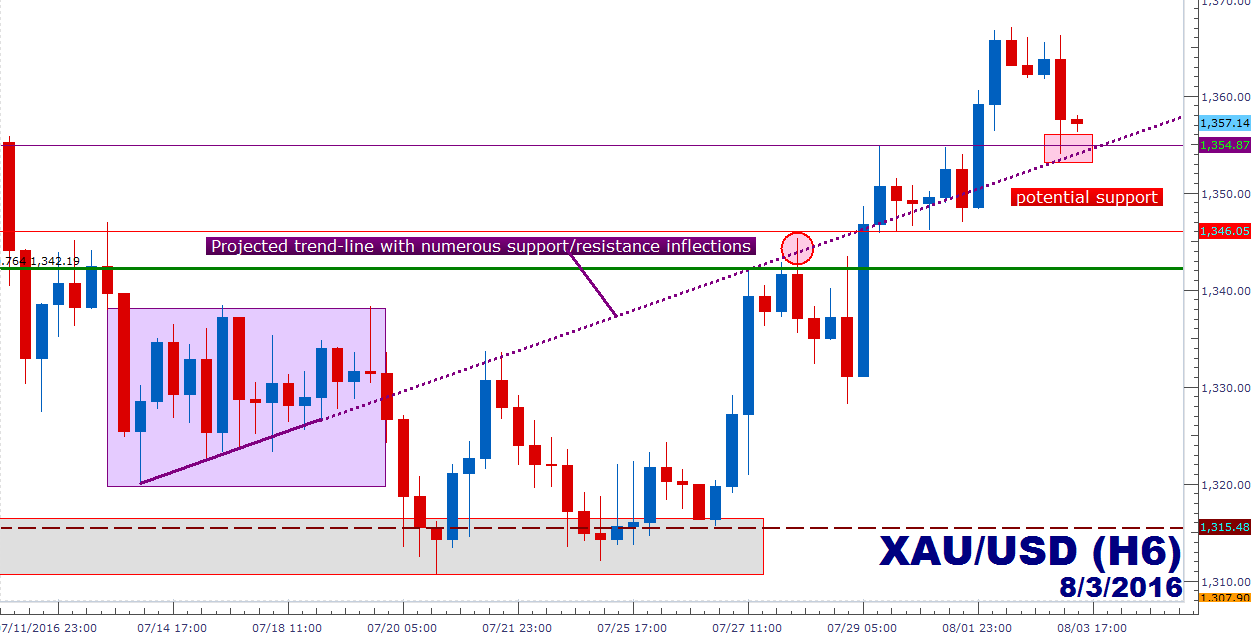
Created with Marketscope/Trading Station II; prepared by James Stanley
Just below this potential support level is the ‘higher-low’ that developed after that rush of strength on the heels of Friday’s GDP announcement at $1,346.05; and a bit lower at $1,342.19, we have the 76.4% Fibonacci retracement of the three-year move in Gold prices.
Traders looking to enter long Gold positions in a more conservative manner would likely want to wait for either a) more confirmation of near-term support at our current level or b) a deeper retracement to one of these more widely-tested levels. For those that want to treat the move aggressively, each of these levels could be potential areas for stop-placement, with targets cast towards the near-term swing-high at $1,367, and then the prior near-term high at the psychological level of $1,375.04.

Created with Marketscope/Trading Station II; prepared by James Stanley
--- Written by James Stanley, Analyst for DailyFX.com
To receive James Stanley’s analysis directly via email, please SIGN UP HERE
Contact and follow James on Twitter: @JStanleyFX


