


To receive James Stanley’s Analysis directly via email, please sign up here.
Talking Points:
- Gold Technical Strategy: Intermediate-term Bullish Trend seeing continued retracement in Gold prices.
- The ‘bigger-picture’ up-trend combined with macro back drop continues to make long-Gold an attractive venue.
- An analyst pick for Long-Gold was set on Friday.
- If you’re looking for trading ideas, check out our Trading Guides. And if you want something more short-term in nature, check out our SSI indicator.
In our last article, we looked at the continued up-trend in Gold and the fact that despite its recent bout of strength, the move was looking quite overbought as indicated by diverging relative strength on the 4-hour chart. And given the way that the top-side move has built in Gold of recent, with strong and quick bursts in the trend-side direction followed by slower, grinding yet bearish price action on retracements; looking for a deeper retracement could be a far more attractive way of trying to catch the top-side move rather than chasing whilst near highs.
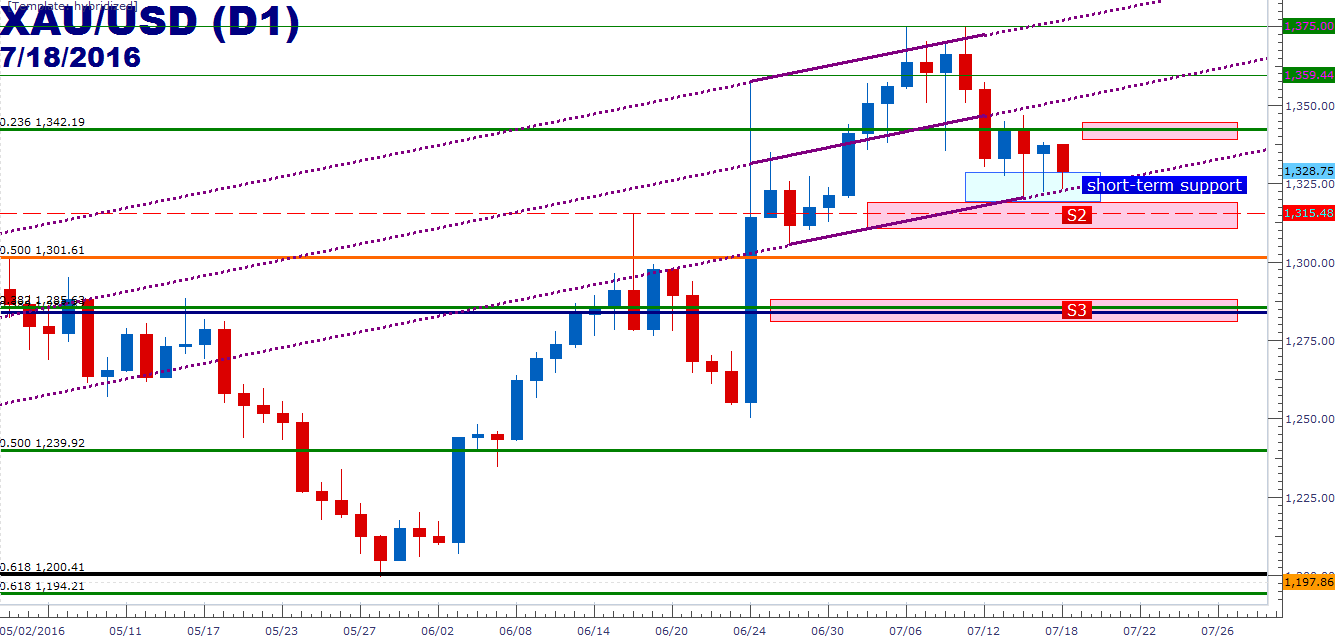
Since the short-term top was set last week just .01 above the prior swing high of the previous week, price action in Gold has continued in a bearish short-term pattern of lower-lows and lower-highs on the 4-hour chart. This set a fresh near-term low on Thursday of last week at $1,320, which is near the top-end of the ‘S2’ support zone that we had identified in our previous article; and since that short-term low was set, we’ve seen multiple instances of buyers coming in to further support gold prices above this level, producing a series of short-term higher-lows on the 4-hour chart (indicated below by the up-ward sloping red line).
On the chart below, we’re looking at the 4-hour variation in Gold prices; and notice how the blue box indicates numerous iterations of support as indicated by elongated wicks, signaling buyers coming-in to the market, helping to produce the series of higher-lows that’s been showing of recent.

Created with Marketscope/Trading Station II; prepared by James Stanley
Traders looking to treat the Gold setup aggressively could look at this attempt to carve-out higher-low support as a potential top-side entry.
For traders that want to tread a bit more conservatively, a deeper retracement could be sought to the more well-heeled, better tested zone of longer-term support/resistance in the $1,283.82-$1,301.61 range, with each of those price levels being derived from longer-term Fibonacci studies. The area around $1,283.82 has two relevant Fibonacci levels within $2 of each other, while $1,301.61 is the 50% retracement of the post-Financial Collapse move in Gold prices.
Created with Marketscope/Trading Station II; prepared by James Stanley
--- Written by James Stanley, Analyst for DailyFX.com
To receive James Stanley’s analysis directly via email, please SIGN UP HERE
Contact and follow James on Twitter: @JStanleyFX


