


Silver Price Forecast Overview:
- US Dollar weakness against the backdrop of heightened US fiscal stimulus expectations has reinvigorated the bullish fundamental backdrop for silver prices.
- A break of the downtrend from the August, September, and November swing highs suggests that the bull flag/triangle that formed in silver prices has yielded a bullish breakout.
- Recent changes in sentiment suggest that silver prices have a mixed outlook in the short-term.
Silver Prices Jump Ahead of December Fed Meeting
Silver prices are pacing higher by more than +2% this Wednesday morning, mere hours before the Federal Reserve concludes their December rate decision. The December Fed meeting, which will produce a new quarterly Summary of Economic Projections, is likely to show more stress on the near-term horizon for the US economy, while longer-term potential has been elevated due to the beginning stages of deploying the coronavirus vaccines. Furthermore, the Fed is likely to suggest that interest rates will remain low for many years – through 2023 is the baseline – a factor that has historically help catalyze gains in silver prices.
Silver Price Fundamentals Continue to Strengthen
In our last silver price forecast it was noted that “ongoing weakness in the US Dollar, even as US Treasury yields creep higher, portends to silver prices withstanding significant downside through the end of the year.” With the US economy in the midst of a record-setting stretch for the coronavirus pandemic (and not in a good way), the prospect of new fiscal stimulus on the horizon has reignited a familiar catalyst for silver’s gains in 2020: more deficit spending in an environment with low interest rates.
It’s still the case that “with government deficits rising and interest rates staying low – much like the 2009 to 2011 window – now that the global economy is looking ahead to a period of significant growth post-pandemic, silver prices have a recent historical precedent to suggest that they are likely to lead gold prices for the foreseeable future.” Along these lines, the silver/gold ratio is at its highest level of the month, and its highest level since September 18.

SILVER PRICE TECHNICAL ANALYSIS: DAILY CHART (DECEMBER 2019 TO DECEMBER 2020) (CHART 1)
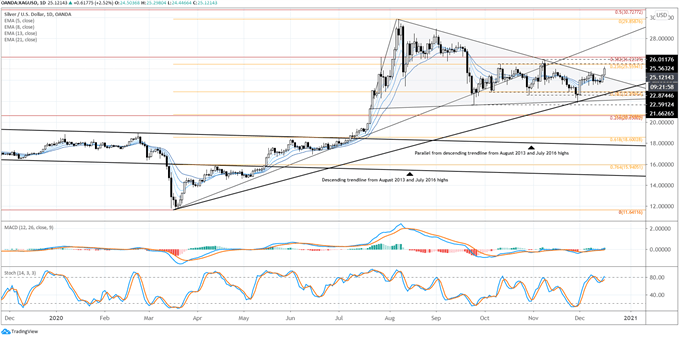
Our last update suggested that “it may be the case that the break through the coronavirus pandemic trendline is insignificant if the triangle is the predominant focus…marginally speaking, silver’s posture has improved within its range.” The range and triangle appear to have broken to the topside, with silver prices pressing a bullish breakout attempt over the past 24-hours, having cleared the descending trendline from the August, September, and November swing highs.
The key test for silver prices now arrives at the 23.62% Fibonacci retracements of the 2020 low/high range at 25.5594. Beyond there, the 38.2% Fibonacci retracement of the 2011 high/2020 low range at 26.2239 comes into focus. Clearing these levels would be a strong signal that silver prices were starting to gather momentum in a breakout trade focusing on a move to fresh highs (relative to what was seen in 2020).
Silver prices are now above their daily 5-, 8-, 13-, and 21-EMA envelope, which is in bullish sequential order. Daily Slow Stochastics are entering overbought condition, and daily MACD is higher, having just recently crossed above its signal line. The path of least resistance appears to be higher for silver prices.
SILVER PRICE TECHNICAL ANALYSIS: WEEKLY CHART (DECEMBER 2010 TO DECEMBER 2020) (CHART 2)
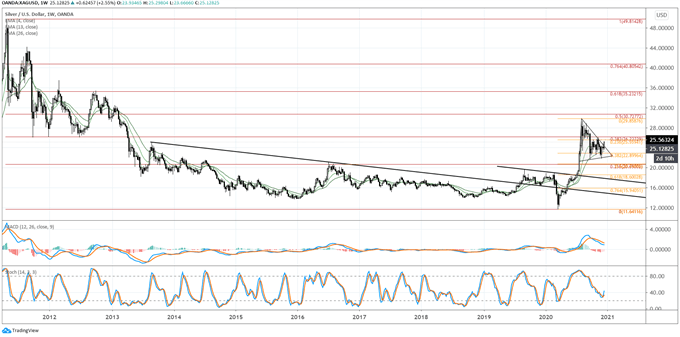
Our long-term bullish view on silver prices remains. “The recent triangle consolidation is occurring in context of the breakout from the downtrend dating back to the August 2013 and July 2016 highs, suggesting that a long-term bottoming effort is still under way. If the silver price triangle were to breakout to the topside, there would be good reason to suspect that the move had meaningful technical tailwinds pushing prices higher.” The bullish breakout in silver prices is now underway.

IG Client Sentiment Index: Silver Price Forecast (December 16, 2020) (Chart 3)
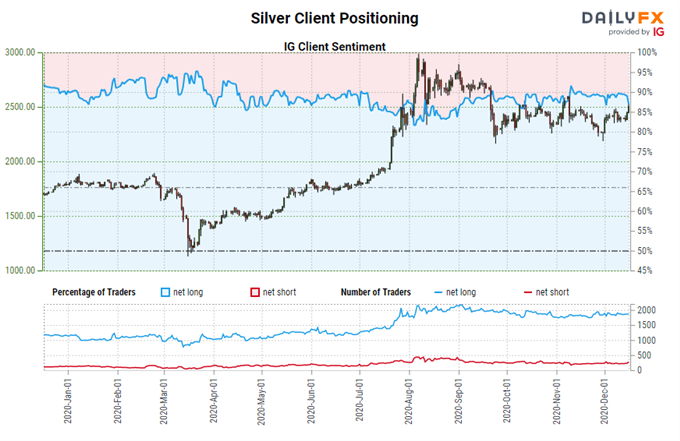
Silver: Retail trader data shows 87.99% of traders are net-long with the ratio of traders long to short at 7.33 to 1. The number of traders net-long is 3.49% higher than yesterday and 3.99% higher from last week, while the number of traders net-short is 4.30% lower than yesterday and 10.79% higher from last week.
We typically take a contrarian view to crowd sentiment, and the fact traders are net-long suggests Silver prices may continue to fall.
Positioning is more net-long than yesterday but less net-long from last week. The combination of current sentiment and recent changes gives us a further mixed Silver trading bias.
Silver Prices and Silver Volatility Back in Sync
Both gold and silver are precious metals that typically enjoy a safe haven appeal during times of uncertainty in financial markets. While other asset classes don’t like increased volatility (signaling greater uncertainty around cash flows, dividends, coupon payments, etc.), precious metals tend to benefit from periods of higher volatility as uncertainty increases silver’s safe haven appeal.
VXSLV (SILVER VOLATILITY) TECHNICAL ANALYSIS: DAILY PRICE CHART (MARCH 2011 TO DECEMBER 2020) (CHART 4)
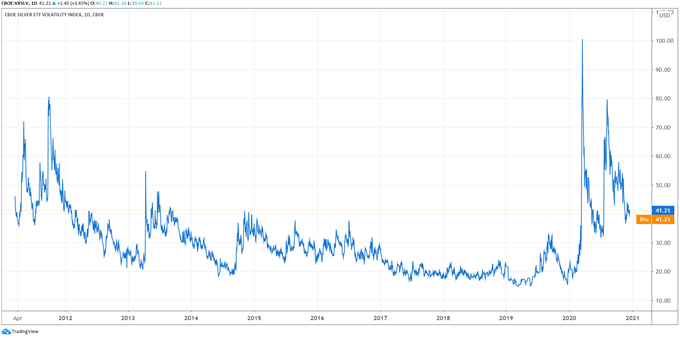
Silver volatility (as measured by the Cboe’s gold volatility ETF, VXSLV, which tracks the 1-month implied volatility of silver as derived from the SLV option chain) was trading at 41.21 at the time this report was written. The 5-day correlation between VXSLV and silver prices is +0.99 and the 20-day correlation is +0.88. One week ago, on December 9, the 5-day correlation was +0.75 and the 20-day correlation was +0.78.
--- Written by Christopher Vecchio, CFA, Senior Currency Strategist


