


Gold Price & Silver Technical Highlights:
- Gold sitting on support, lacking much buying interest
- Silver looks set to trade lower out of a congestion pattern
Gold sitting on support, lacking much buying interest
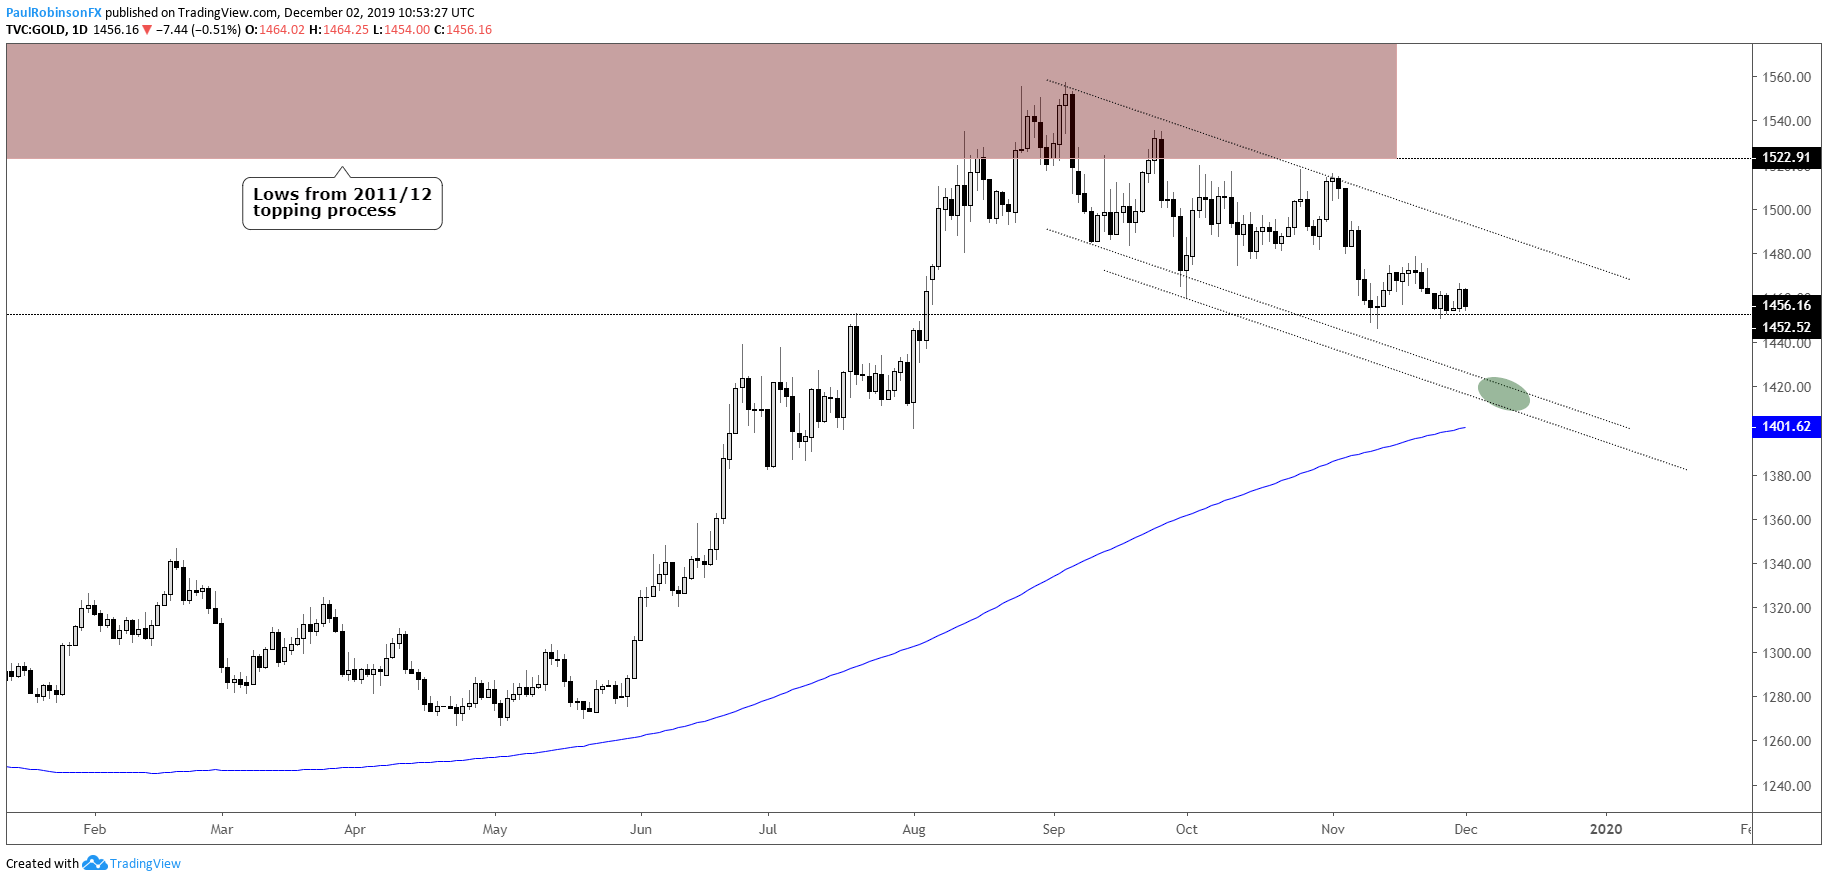
Since the sell-off during the first half of November gold has sat on support around the 1450 area for the past couple of weeks. The lack of bullish response after taking a hard hit suggests that there is more selling to come.
A breakdown below 1445 should garner selling for another swing lower, but isn’t seen as turning into anything more than just a minor leg down. The broader context is that of a developing bull-flag, one that has been building for nearly three months, and should at some point lead to another big-picture charge higher.
A decline from current levels could have the lower-end of the pattern tested, and if it’s to remain a valid pattern, buyers should step in around the 1425/15 zone, where resides the lower parallel tied to the top-side trend-line.
For now, all-in-all, the outlook is bearish in the near-term, but could turn bullish after another minor decline. Should we see an upswing develop from just below here or even from current levels, to get gold moving out of the bull-flag price will need to cross above the top-side trend-line of the pattern, currently around the 1490 level.
Trading Forecasts and Educational Guides for traders of all experience levels can be found on the DailyFX Trading Guides page.
Gold Price Daily Chart (lack of support inside bull-flag)
Gold Price Chart by TradingView
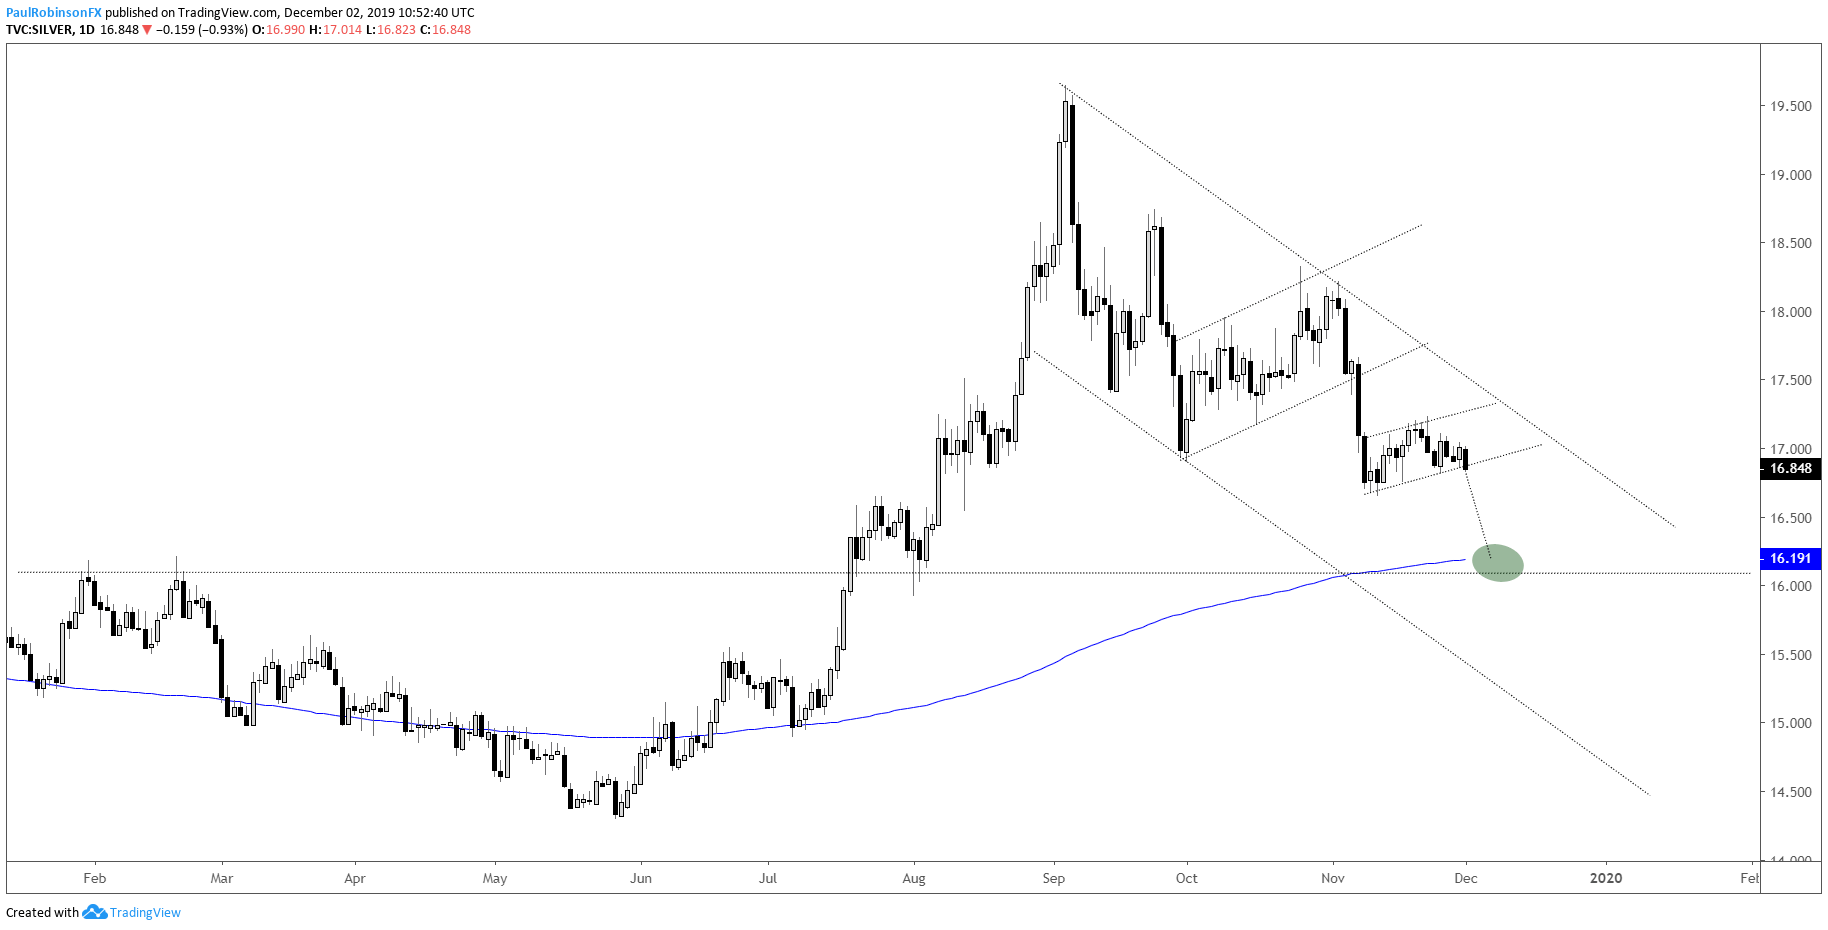
Silver has and continues to look weaker than gold. It’s also failing to garner any attention from buyers, and this has a bear-flag-like pattern setting it up for a run lower to the 200-day MA. A breakdown below 16.64 should do the trick to get silver hitting not only the long-term moving average, but also the peaks from January and February that are in confluence. A fair amount of work will be needed to bring a bullish outlook into scope.
Silver Daily Chart (looking to break congestion pattern)
***Updates will be provided on the above technical outlook in webinars held at 1030 GMT on Tuesday and Friday. If you are looking for ideas and feedback on how to improve your overall approach to trading, join me on Thursday each week for the Becoming a Better Trader webinar series.
Resources for Forex & CFD Traders
Whether you are a new or experienced trader, we have several resources available to help you; indicator for tracking trader sentiment, quarterly trading forecasts, analytical and educational webinars held daily, trading guides to help you improve trading performance, and one specifically for those who are new to forex.
---Written by Paul Robinson, Market Analyst
You can follow Paul on Twitter at @PaulRobinsonFX


