


Gold Price/Silver Technical Outlook:
- Gold price testing wedge-break, trend-line
- Silver stalling at underside of 2003 trend-line
- Broad trading bias higher, but may be neutral for now
For an intermediate-term fundamental and technical viewpoint, see the Q3 Gold Forecast.
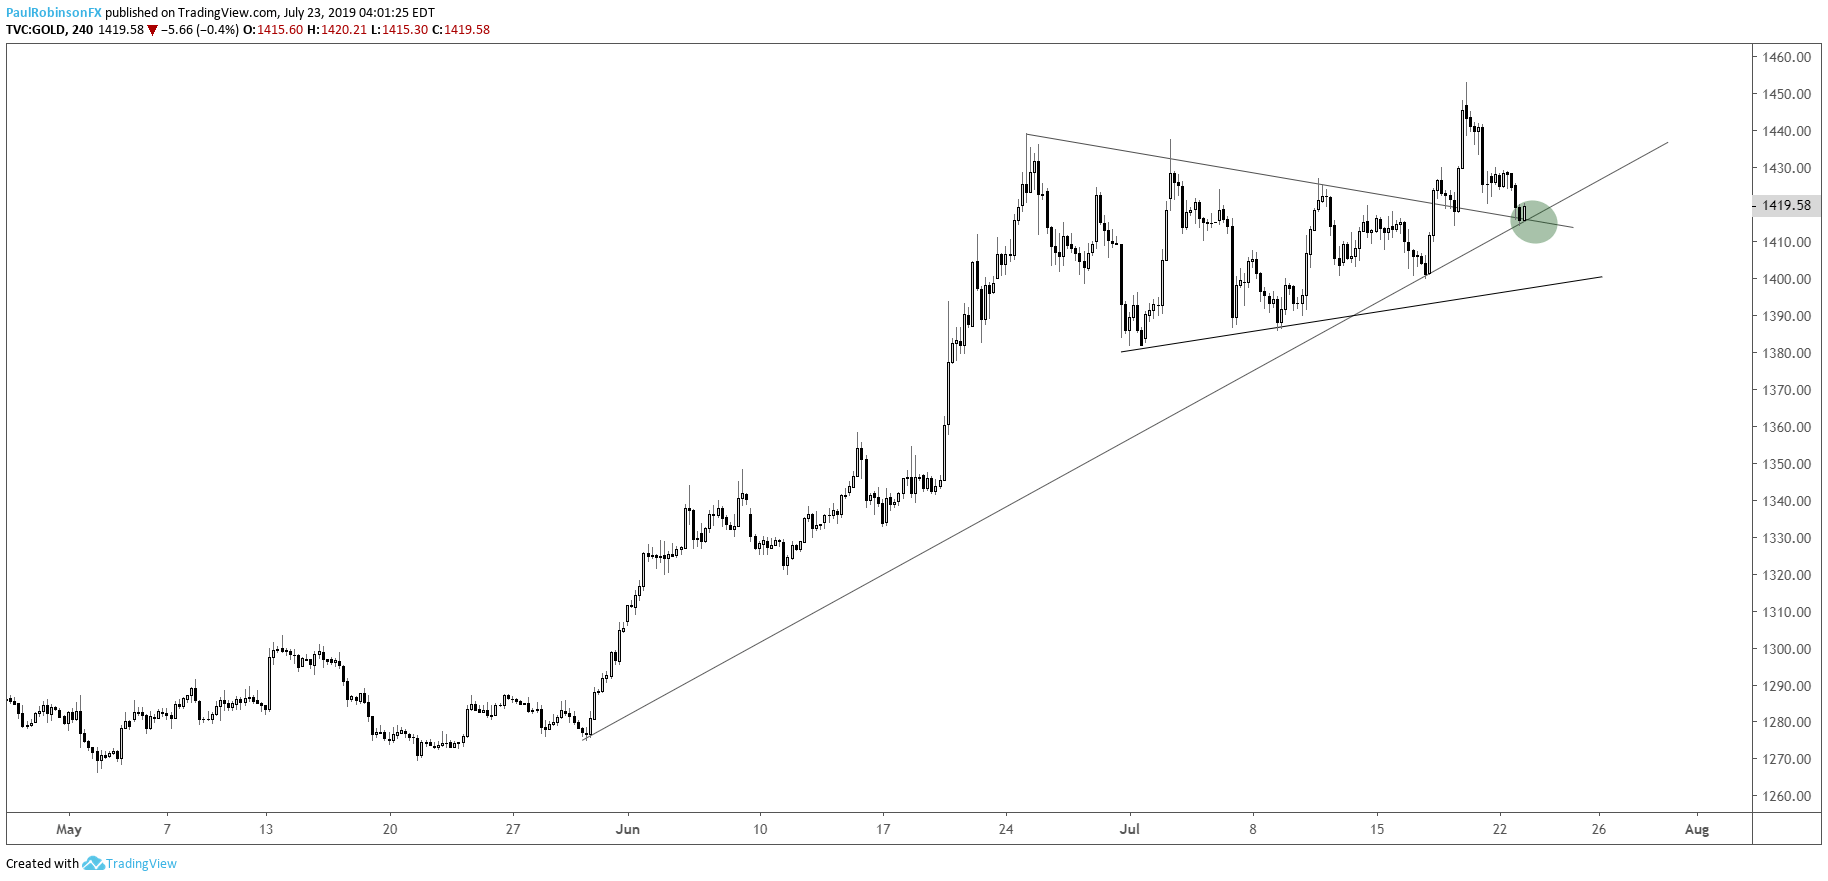
Gold price testing wedge-break, trend-line
Last week, gold broke out of a multi-week consolidation wedge and looked poised to continue a bit higher following the breakout, but right now we are seeing the initial leg higher wiped away and price working back towards falling inside the wedge.
The top-side trend-line of the wedge is in confluence with a trend-line dating back to the May 30 pivot higher. This is a crucial spot in the short-term. If price falls back inside the wedge and through the other side of it then the reversal will be set up to lead to even more weakness.
At that juncture, a decline down 1375 and worse, down to the 1340s (multi-year wedge-break) could be in the works.
But before looking too far ahead, gold is at support and a decent-looking spot from a risk/reward perspective for would-be longs.
Gold Price 4-hr Chart (Testing wedge, trend-line combo)
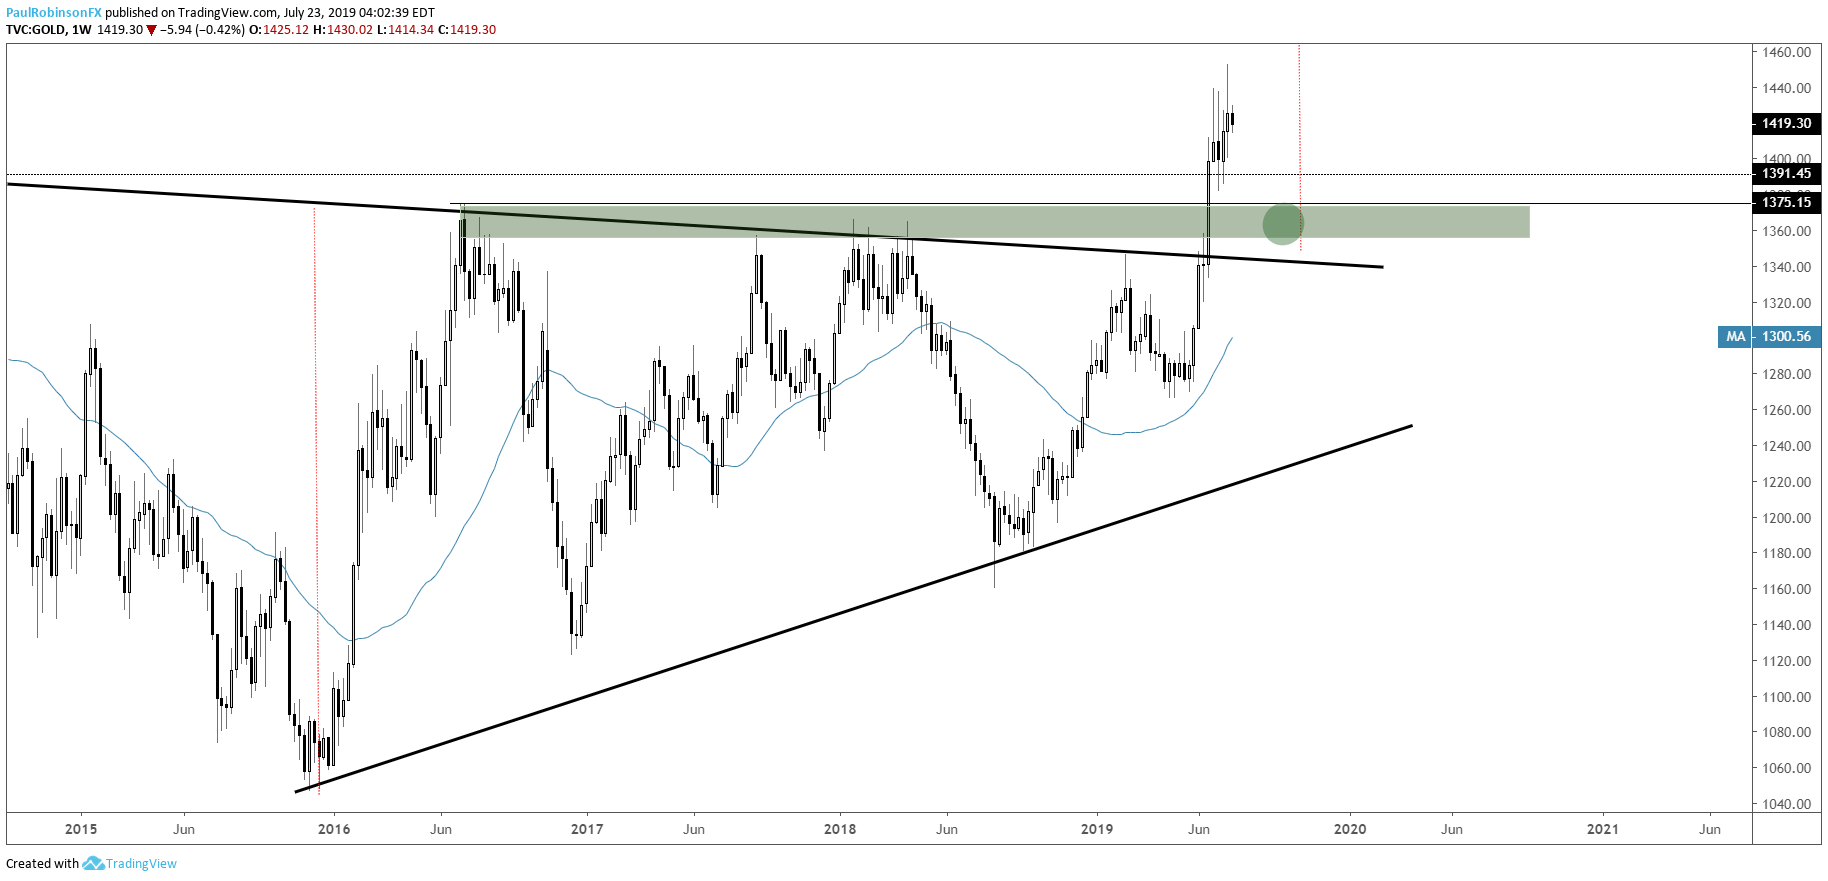
Gold Price Weekly Chart (failure could lead to long-term breakout levels)
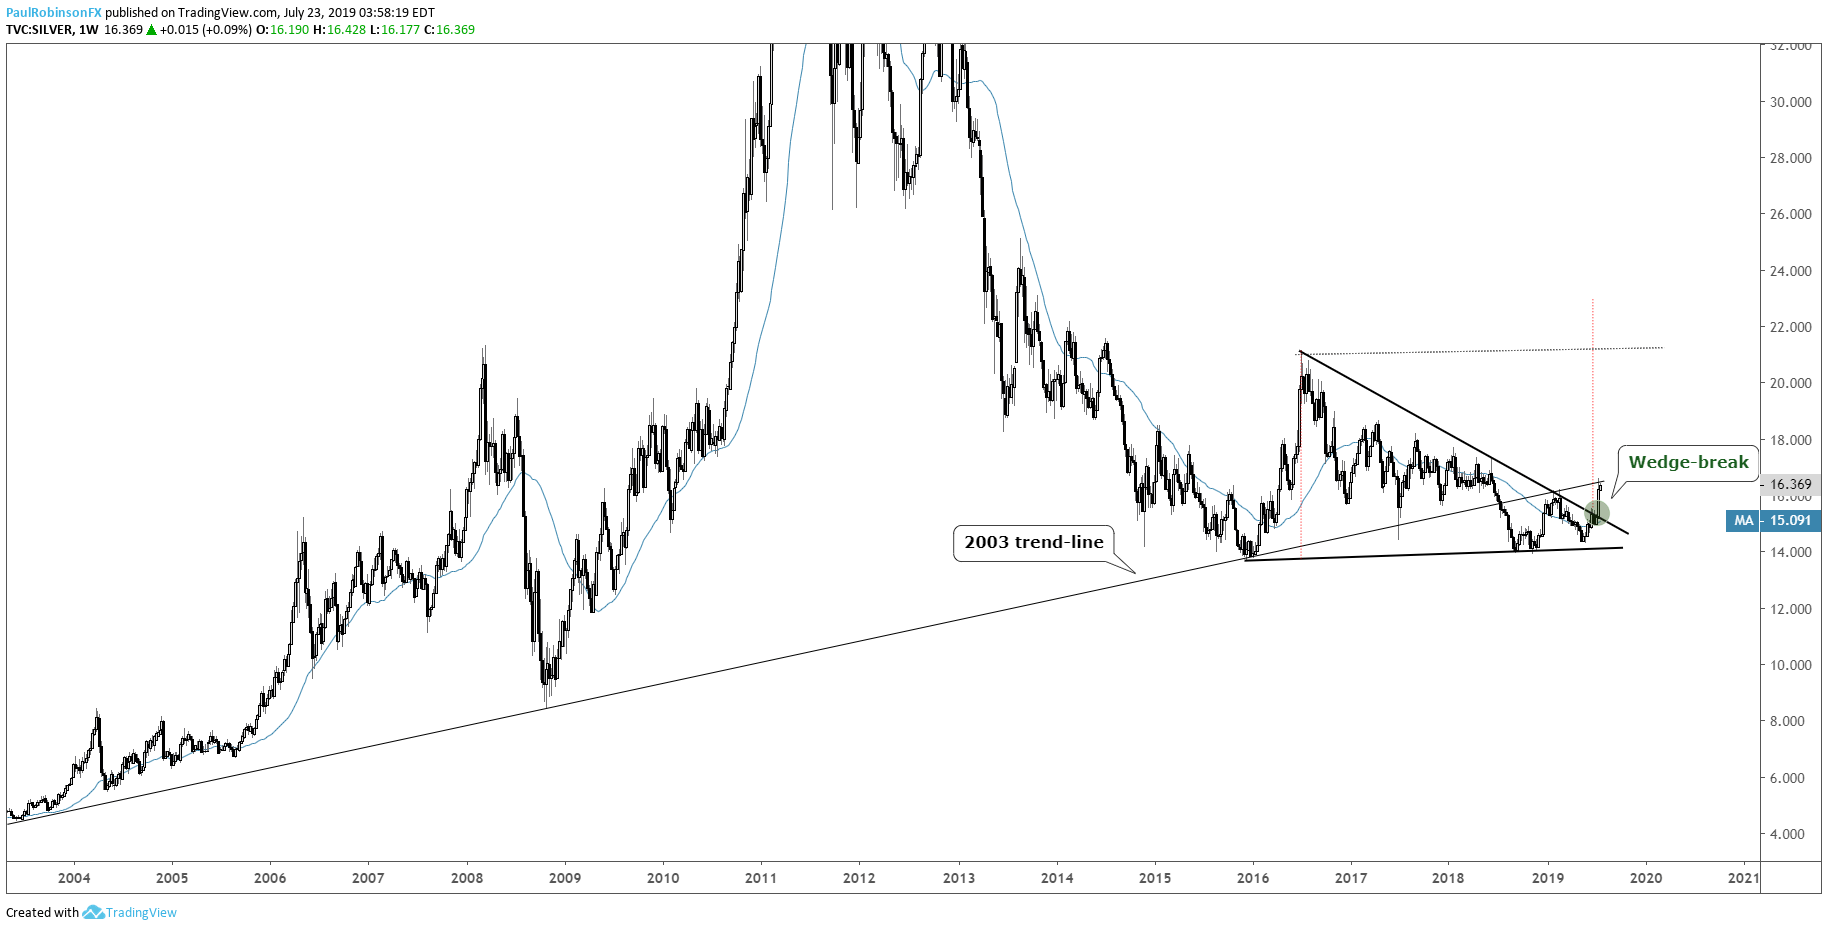
Silver stalling at underside of 2003 trend-line
Silver has been outperforming gold recently and this could continue to be the case as reversion to the mean unfolds in the gold/silver ratio. Looking at silver by itself, it is holding strong right now, however; it has a sizable trend-line running up from 2003 to overcome.
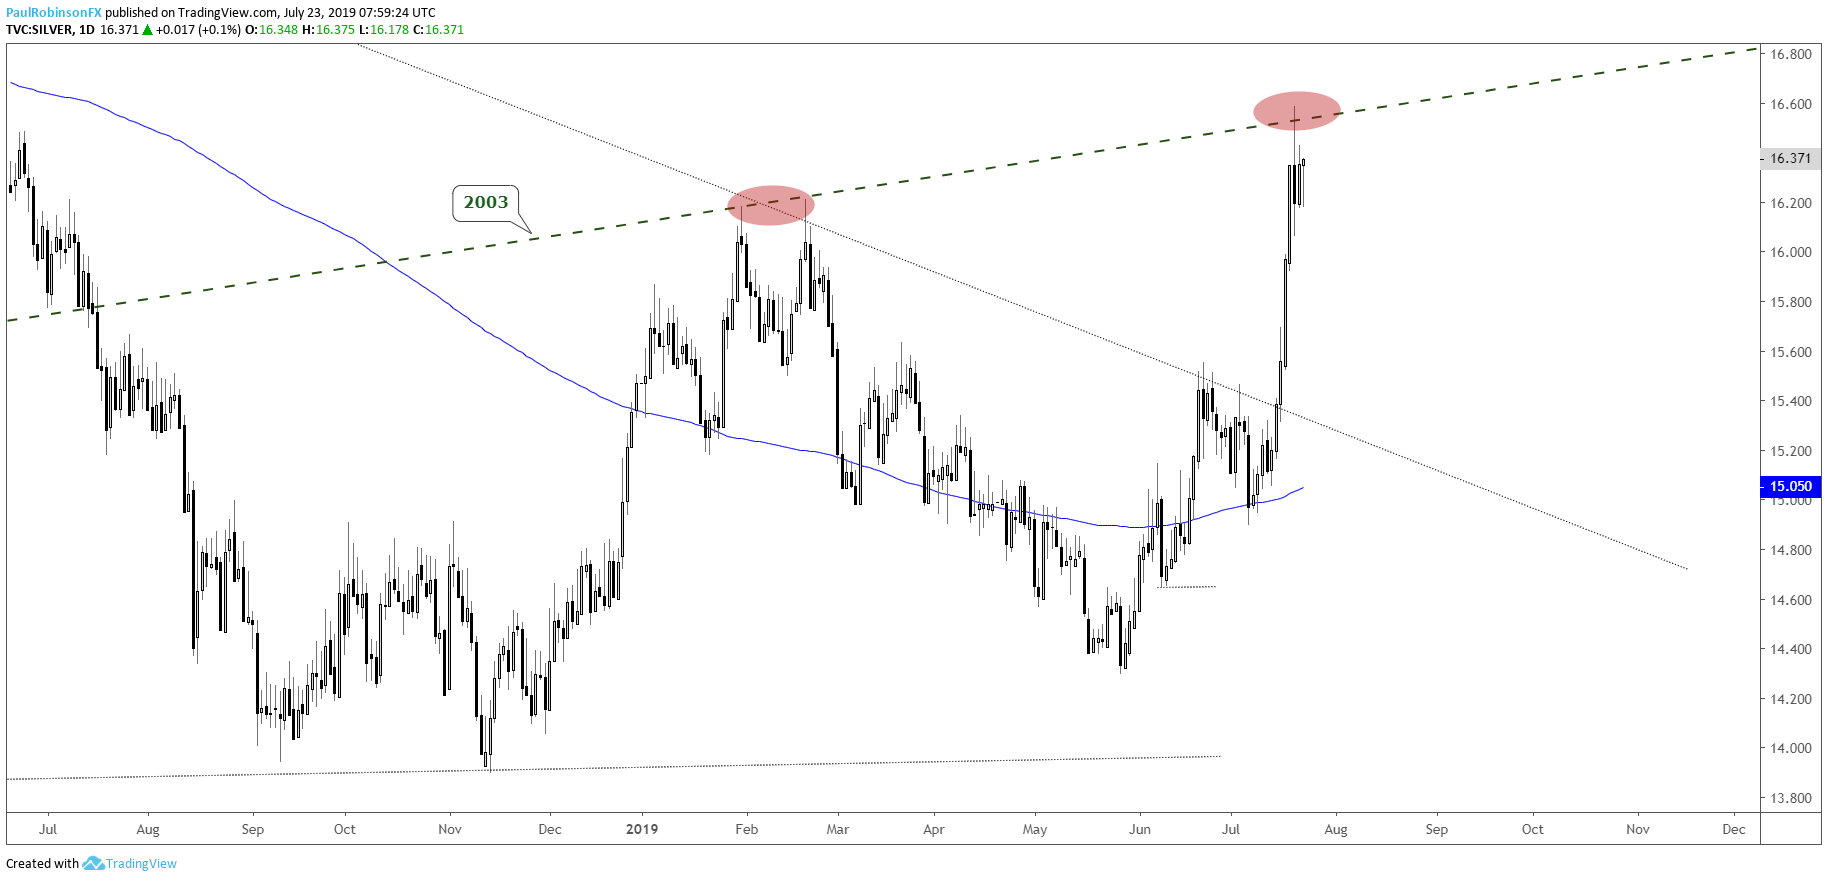
The last time the line was visited – January/February – silver turned lower twice, with the second turn resulting in significant weakness. It could dent the current rally similarly, but if silver’s wedge breakout last week has anything to say about it, then we should see price pull off only modestly or consolidate before trading on through.
Even if we see a bullish resolotion at some point, resistance is resistance until it’s not, so it will be respected as such until it is broken. This gives pause to longs, perhaps skews short-term forces in favor of shorts.
Check out the IG Client Sentiment page to see how changes in trader positioning can help signal the next price move in gold and other major markets and currencies.
Silver Price Weekly Chart (broke wedge, testing 2003 t-line)
Silver Price Daily Chart (2003 t-line)
Resources for Forex & CFD Traders
Whether you are a new or experienced trader, we have several resources available to help you; indicator for tracking trader sentiment, quarterly trading forecasts, analytical and educational webinars held daily, trading guides to help you improve trading performance, and one specifically for those who are new to forex.
---Written by Paul Robinson, Market Analyst
You can follow Paul on Twitter at @PaulRobinsonFX


