


Gold Price & Silver Technical Outlook:
- Gold price slipping below 8-month trend-line
- Yearly low and 200-day targeted next on break
- Silver looking towards 14 for next level of meaningful support
See what intermediate-term fundamental drivers and technical signposts our team of analysts are watching in the DailyFX Q2 Gold Forecast.
Gold price slipping below 8-month trend-line
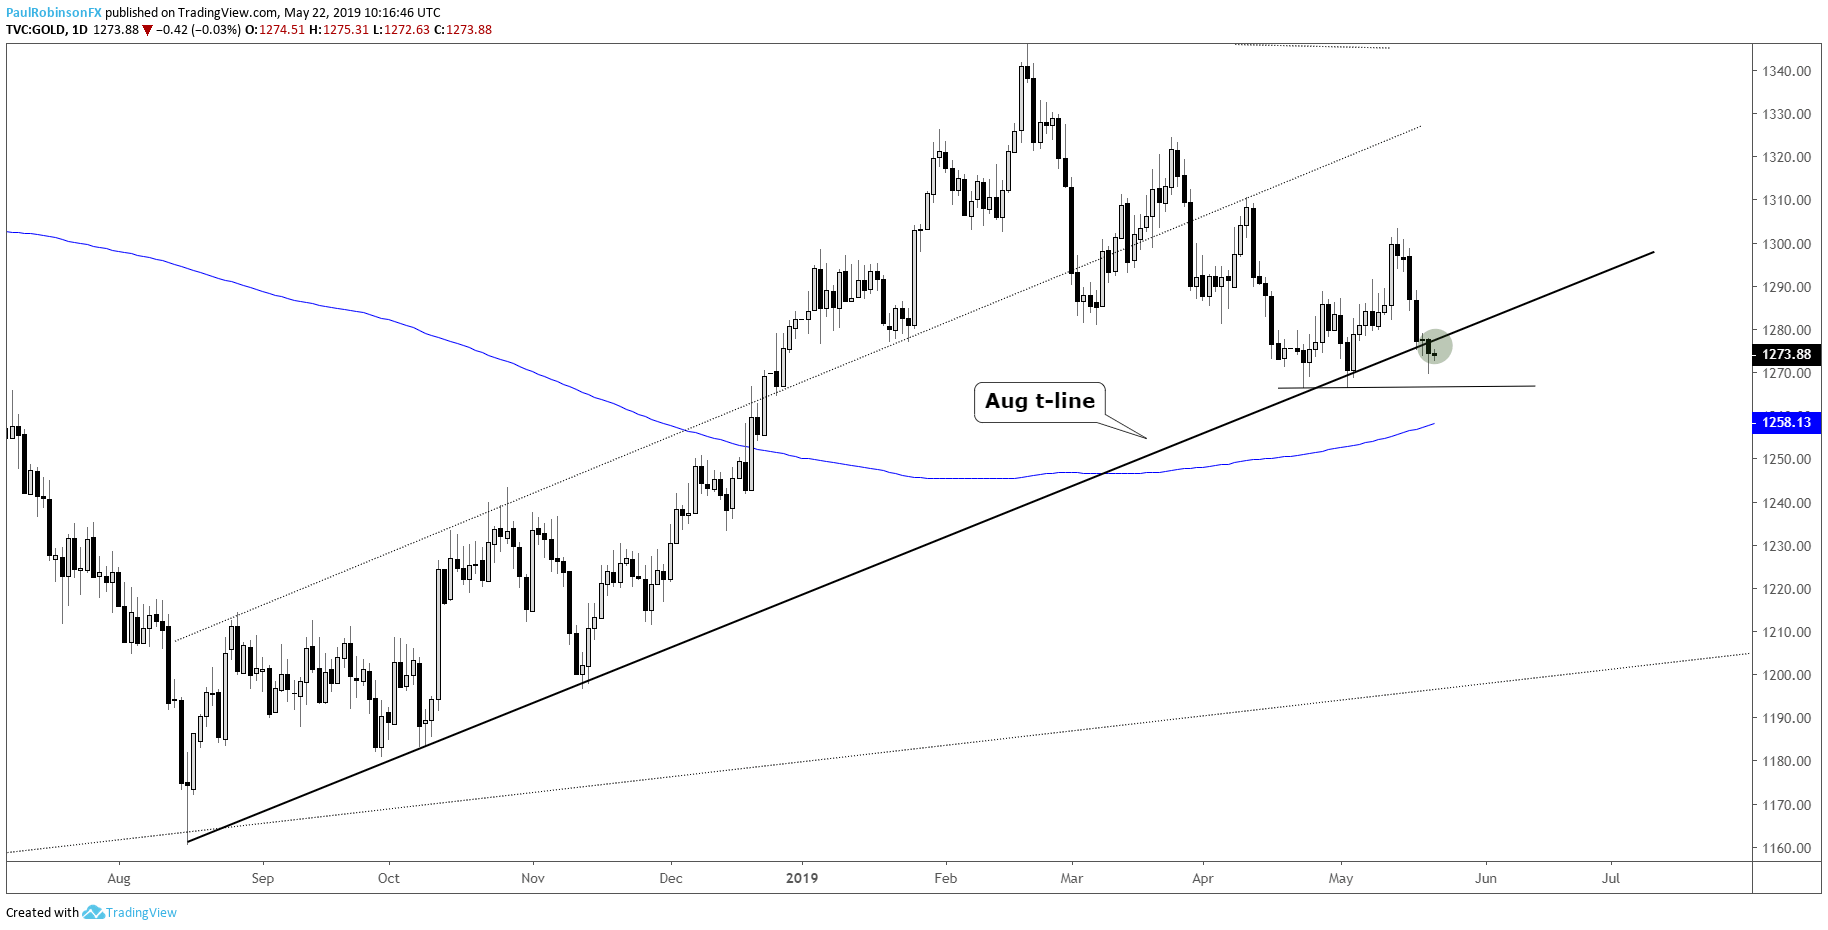
As of yesterday, gold price is beginning to edge below the August trend-line. It’s a steady line of support that if broken will open up a path towards lower levels in the days ahead. The next level to watch is the yearly low at 1266, which happens to be a double-bottoms created on the August trend-line late last, early this month.
Below there the next potentially meaningful line of support comes by way of the 200-day MA. In the past at times it has acted as good support and resistance and at other times meant very little. Broadly speaking, though, there is still plenty of room for gold to fall before getting to the low-end off the long-term wedge still under development.
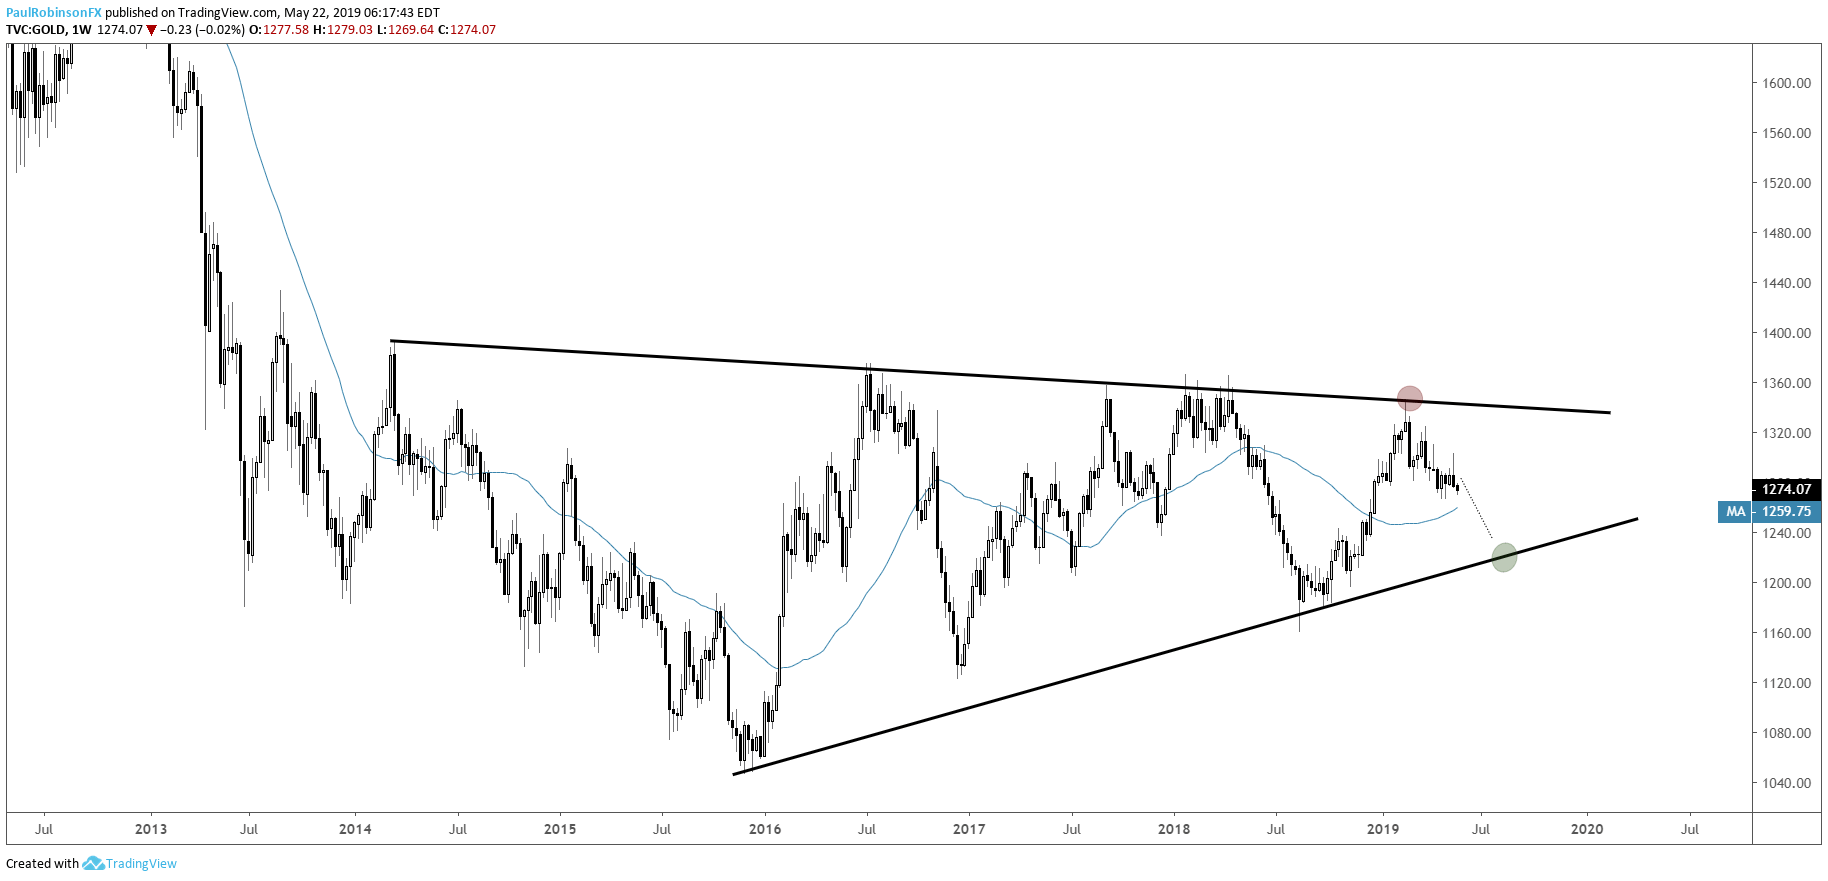
The underside trend-line of the massive pattern dates back to the end of 2015. It’s a moving target given its upward slope, but leaves roughly $45 or more of weakness from current levels before being met.
At this time, to turn the outlook bullish gold will need to quickly turn higher and begin forming a base that eventually leads to a solid breakout back above 1303; this currently looks like a lower probability scenario with yearly lows looking to be just around the bend.
Check out the IG Client Sentiment page to see how changes in trader positioning can help signal the next price move in gold and other major markets and currencies.
Gold Price Daily Chart (Aug t-line, 1266, 200-day)
Gold Price Weekly Chart (Targeting bottom of wedge)
Silver looking towards 14 for next level of meaningful support
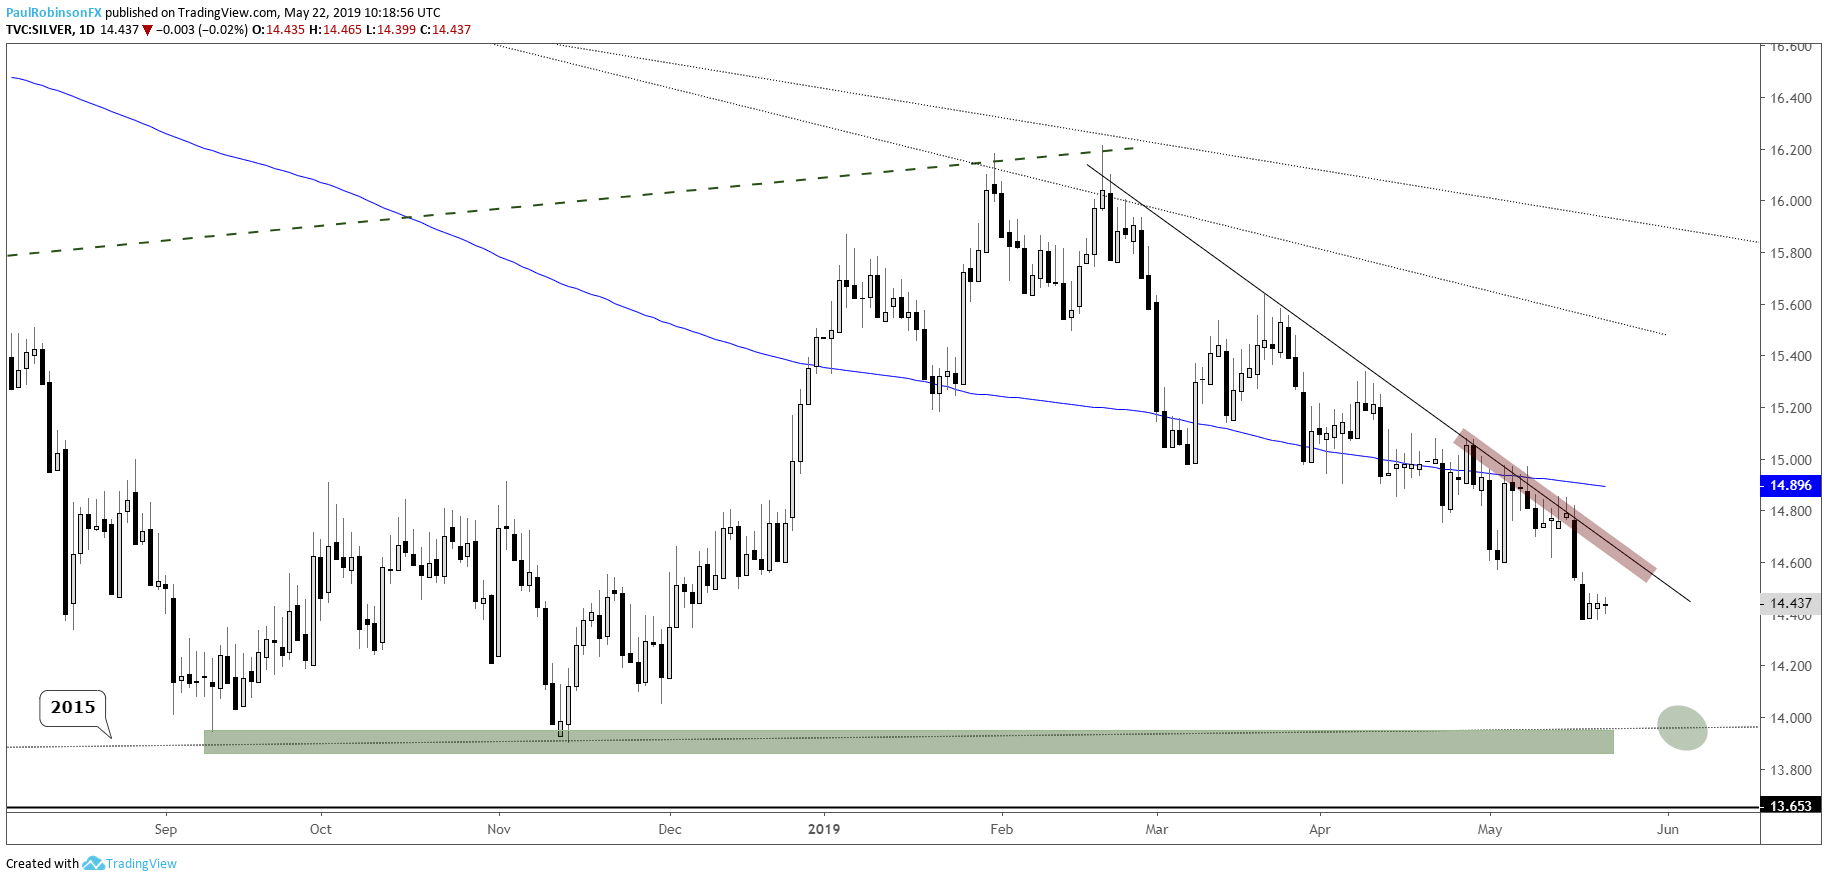
Silver was never able to break above the trend-line running down off the February peak, and with another recent round of weakness it has put itself firmly at risk of further losses. Looking to the next meaningful level of support, we have to look to the 2018 lows just under 14.
There is also a line running over from the 2015 low of 13.65 right in the vicinity of 14, which helps make the area around 14 a solid one to watch should we soon see it. To turn the picture bullish a good deal of work will need to be done; for starters, bottoming, but then a break above the steadfast trend-line from the yearly highly will be required for top-side momentum to have a chance at picking up.
Silver Price Daily Chart (looks headed to sub-14)
Resources for Forex & CFD Traders
Whether you are a new or experienced trader, we have several resources available to help you; indicator for tracking trader sentiment, quarterly trading forecasts, analytical and educational webinars held daily, trading guides to help you improve trading performance, and one specifically for those who are new to forex.
---Written by Paul Robinson, Market Analyst
You can follow Paul on Twitter at @PaulRobinsonFX


