


Gold (XAU) and Silver (XAG) Price Analysis and Charts.
- Gold (XAU) overbought and lower prices likely in the short-term.
- Silver (XAG) oversold but technical indicators continue to weigh.
DailyFX Q2 Forecasts and Top 2019 Trading Opportunities.
Gold (XAU) Remains Overbought in the Near-Term
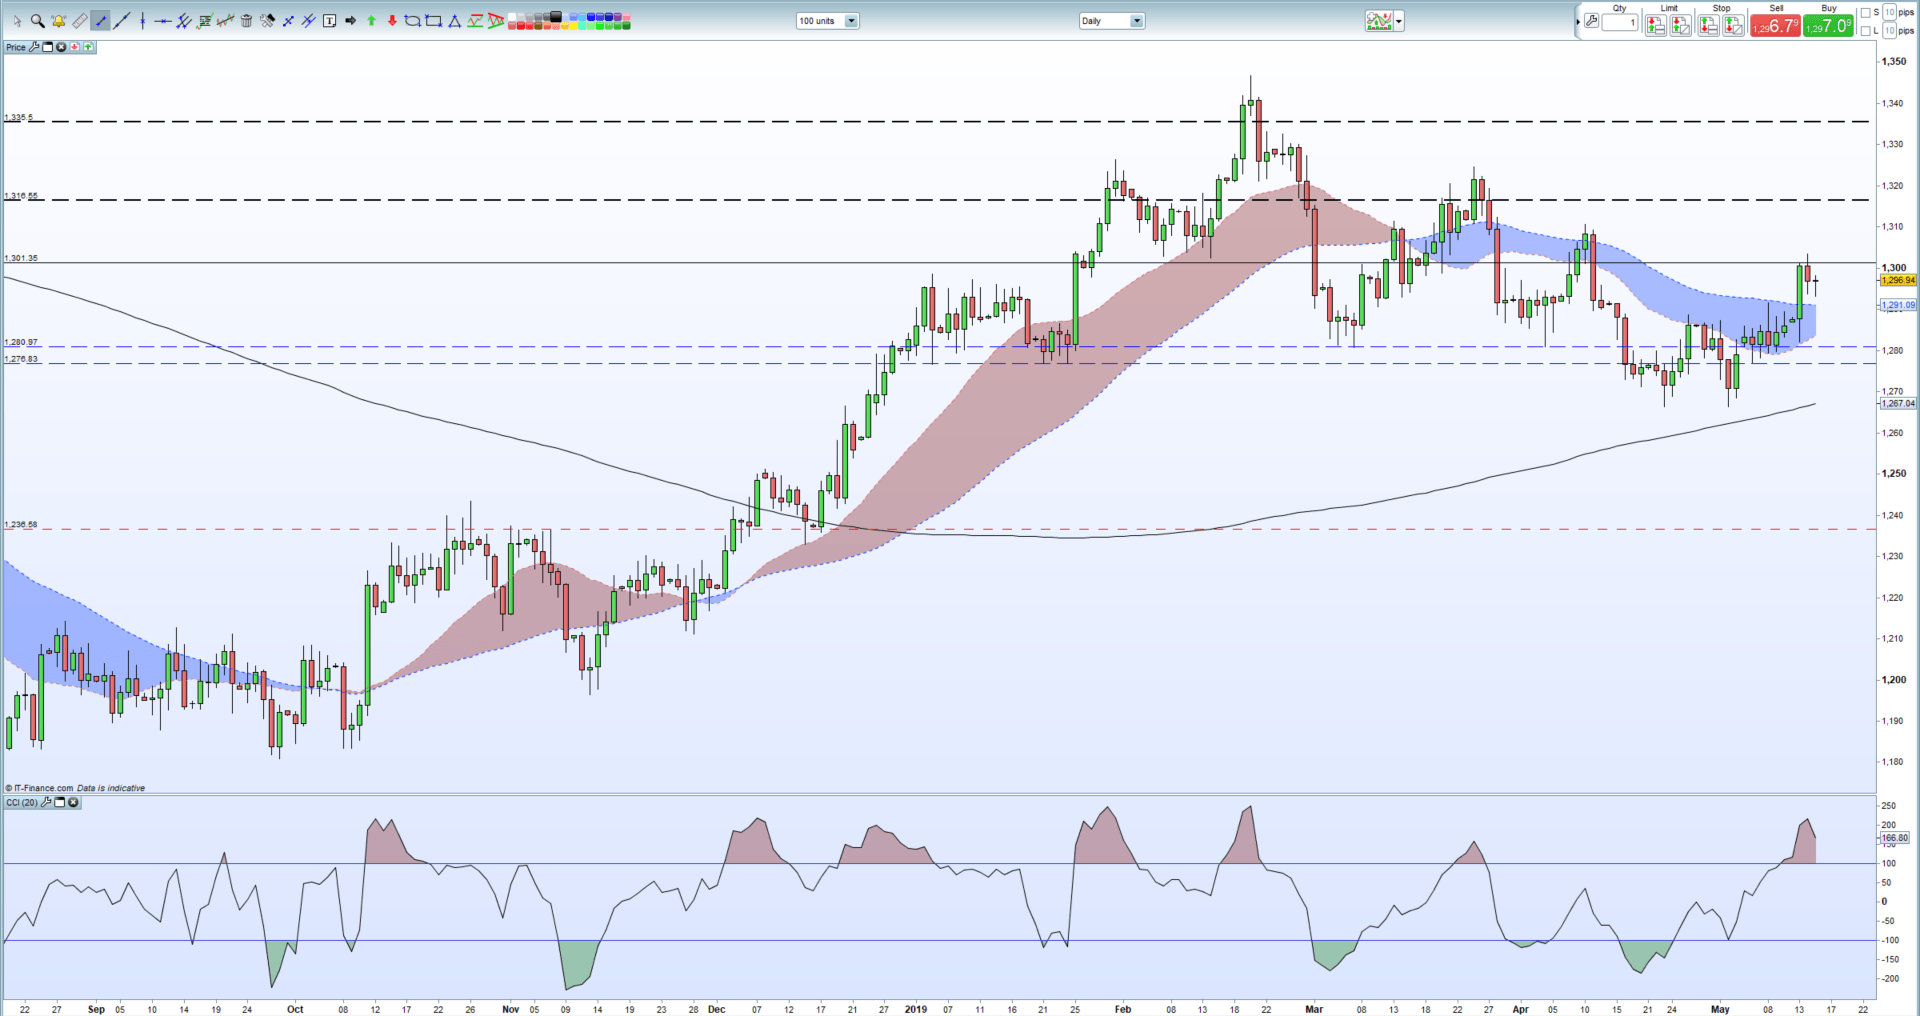
Gold is looking likely to fade slightly lower in the short-term with one technical indicator – CCI – continuing to flash an overbought signal for the precious metal. The recent one-month high made yesterday, pushed the CCI indicator to its highest level since late-February when the price of gold was trading more than $1,340/oz. Any short-term sell-off will likely be constrained by support at $1,292/oz. ahead of the 61.8% Fibonacci retracement level at $1,287/oz. Below there, old horizontal support levels at $1,281/oz. and $1,277/oz. come into play.
How to Trade Gold: Top Gold Trading Strategies and Tips
Gold (XAU) Daily Price Chart (August 2018 – May 15, 2019)
Silver (XAG) – Downtrend Remains in Place
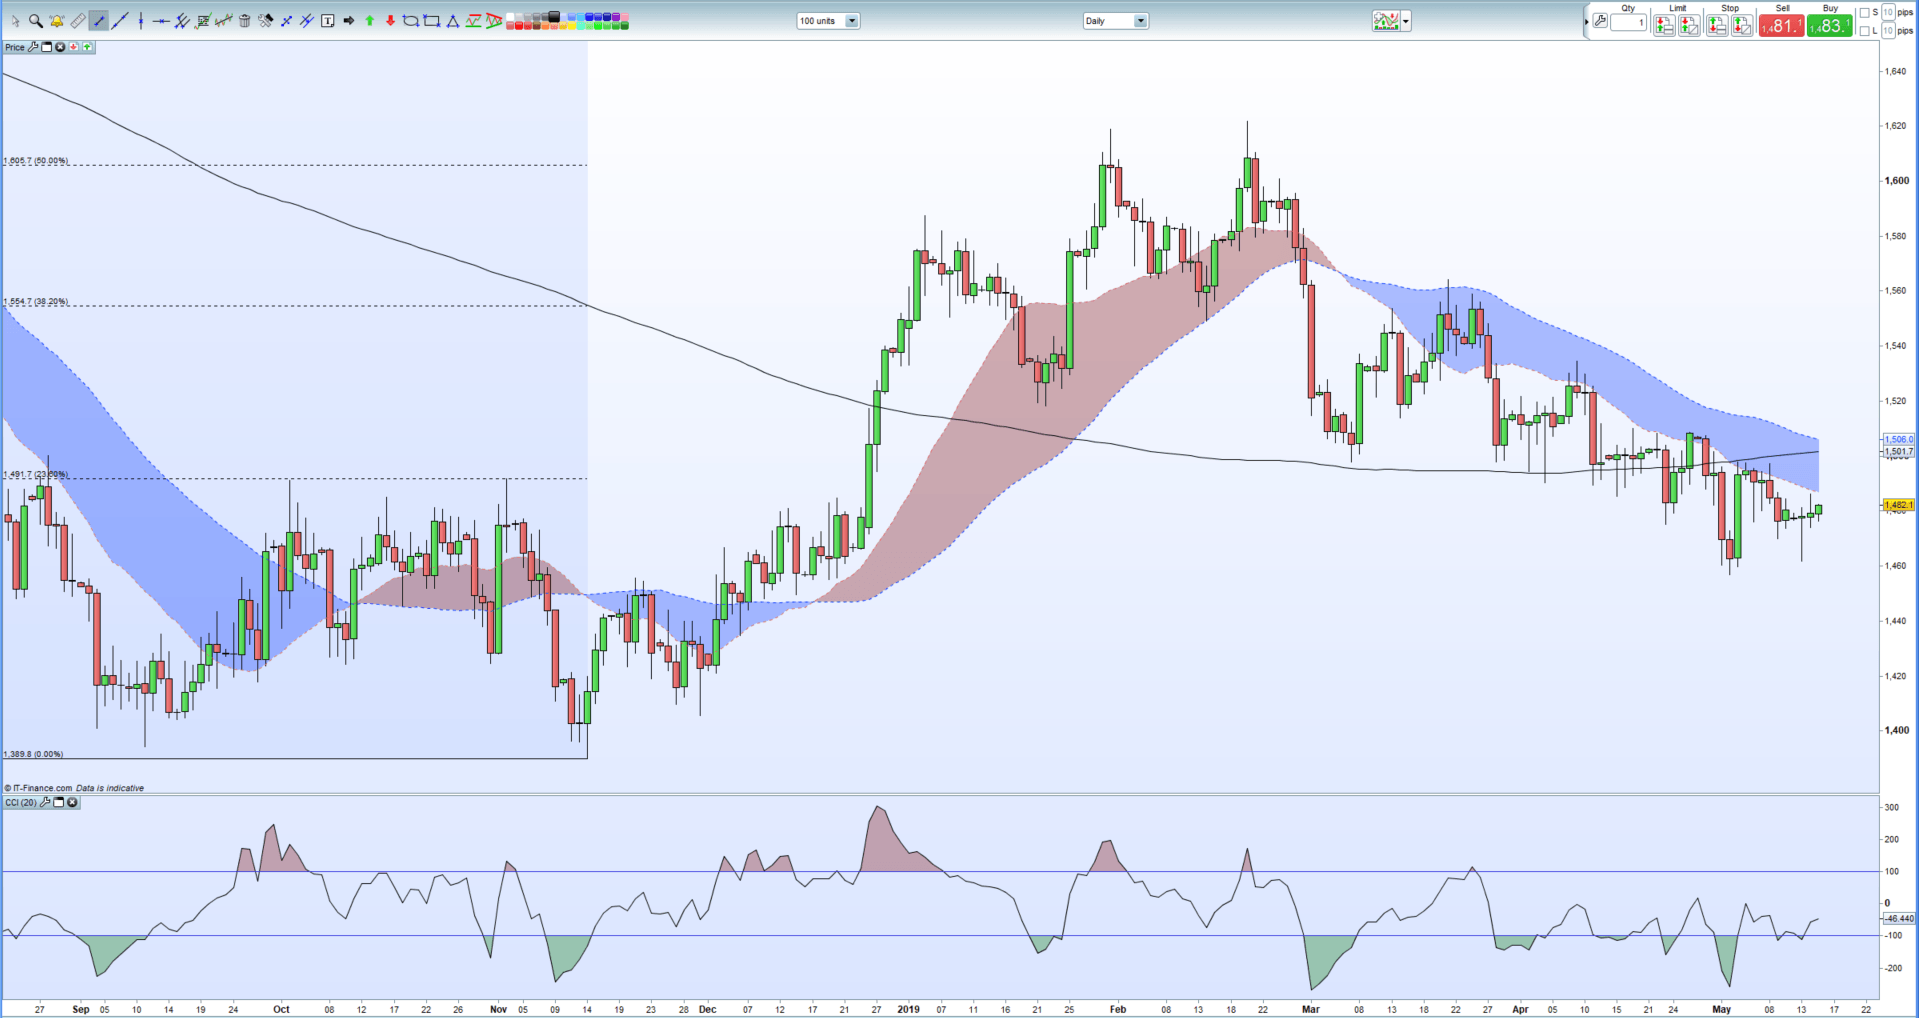
A series of lower highs off the February 20 high print dominates Silver’s chart and suggests lower prices ahead. Silver currently changes hands at $14.82 and is under pressure from a technical perspective, as it trades below all three moving averages and the 23.6% Fibonacci retracement level at $14.91, its initial upside target. For a medium-term bear market to gain more credence, Silver will need to close below the May 2 low at $14.56 to establish a fresh lower low. The CCI indicator has moved out of oversold territory but recent upticks have proved weak and short-lived.
Silver (XAG) Daily Price Chart (August 2018 - May 15, 2019)
Trading the Gold-Silver Ratio: Strategies and Tips.
IG Client Sentiment shows that retail traders are 72.2% net-long gold, a bearish contrarian indicator. However, recent daily and weekly sentiment shifts suggest that the price of gold may shift higher, despite traders being net-long.
--- Written by Nick Cawley, Market Analyst
To contact Nick, email him at nicholas.cawley@ig.com
Follow Nick on Twitter @nickcawley1


