


Gold Price & Silver Technical Points:
- Gold price can’t rise above confluent resistance
- Silver trading at trend-line, top of wedge
- Trends favor lower prices until resistance broken
See what intermediate-term fundamental drivers and technical signposts our team of analysts are watching in the DailyFX Q2 Gold Forecast.
Gold price can’t rise above confluent resistance
Trading gold recently hasn’t been a clean game as it has become stuck between support and resistance. We aren’t seeing gold find much of a bid today from either risk-off in equities or the Dollar dropping. Perhaps a sign of relative weakness, perhaps not.
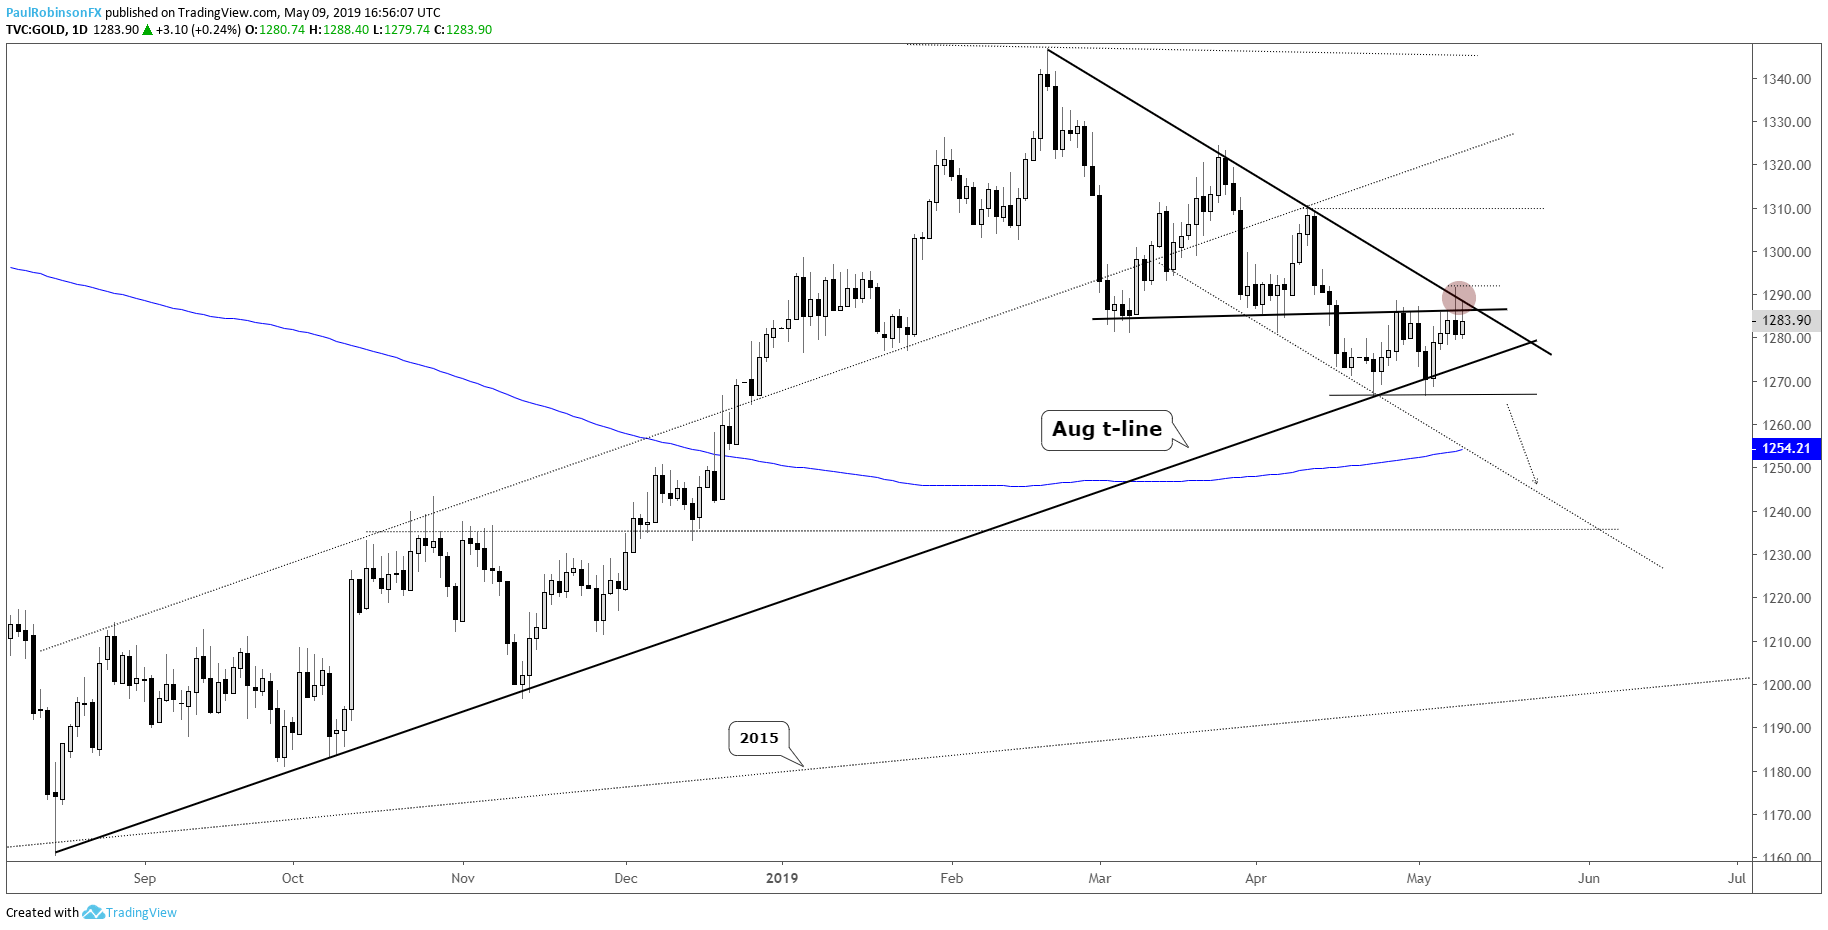
Looking at the technical picture in a vacuum there are two forms of resistance coming together to keep a lid on gold, in addition to it having a weak trend and recent pattern-break. The trend-lines from both the top and bottom-side of the descending wedge formation in place since February arrive in the same vicinity.
There was a nice rejection candlestick on Wednesday which helped solidify the confluent lines as highly relevant in the near-term. Maintain below the rejection-day high of 1292 and the outlook is neutral at best. A decline from current levels will quickly bring into play the important August trend-line, with a break below that threshold bringing into play the bottom of the recent range at 1266.
A break of 1266 is needed for full confirmation that gold wants to build on the trend since the top created in February, with the 200-day and 1230s up next as targeted support. A break above the trend-line and 1292 high will be somewhat encouraging for longs and bring into play resistance first up around the 1310-mark.
Before getting too excited about a break, though, we may see some more range activity first. One side or the other will give-way at some point; right now, the edge still remains tilted towards the downside.
Check out the IG Client Sentiment page to see how changes in trader positioning can help signal the next price move in gold and other major markets and currencies.
Gold Price Daily Chart (watch 1292, 1266)
Silver trading at trend-line, top of wedge
Silver posted a strong fake-out last week when it broke down from a falling wedge and then quickly reversed course. It threatened to then break the top of the wedge which would have given silver a bullish bias. However, as we are seeing it is starting to drift back lower again. A break below 14.56 will negate the bullish day and have silver looking lower again. To confirm a top-side wedge-break confirmation is seen as breaking out above a minor swing level at 15.10.
Silver Daily Chart (riding on falling wedge t-line)

Resources for Forex & CFD Traders
Whether you are a new or experienced trader, we have several resources available to help you; indicator for tracking trader sentiment, quarterly trading forecasts, analytical and educational webinars held daily, trading guides to help you improve trading performance, and one specifically for those who are new to forex.
---Written by Paul Robinson, Market Analyst
You can follow Paul on Twitter at @PaulRobinsonFX


