


Gold/Silver technical highlights:
- Gold & silver oversold, but have an uphill battle
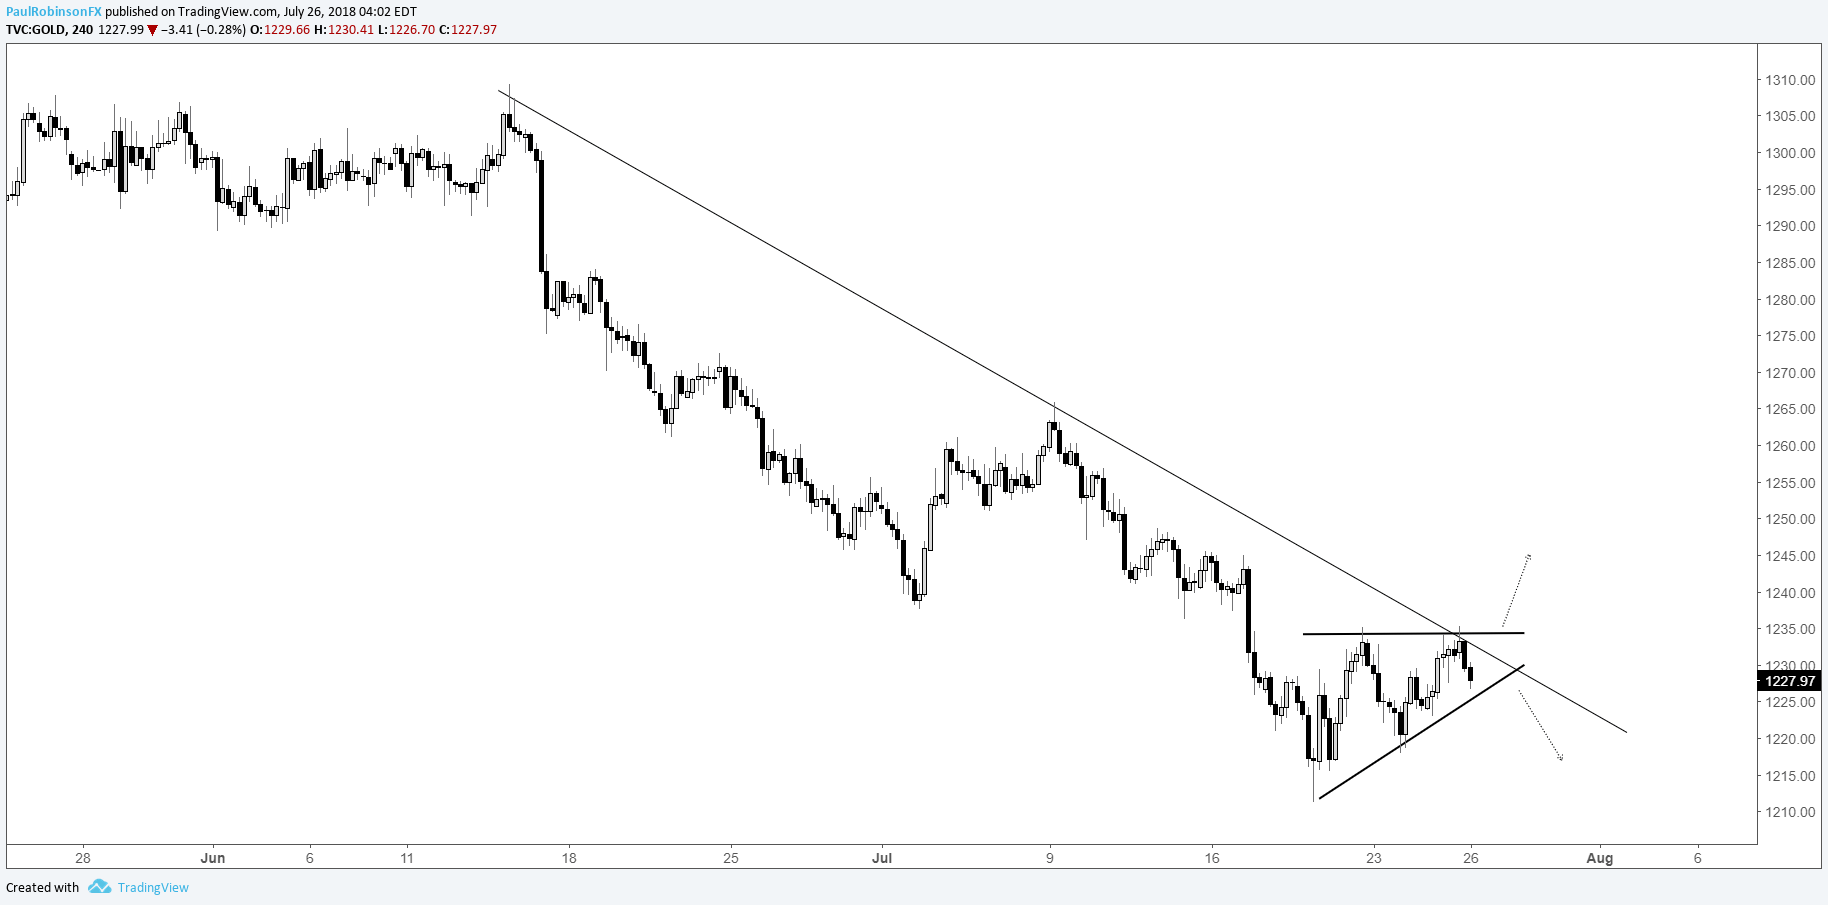
- 4-hr ascending wedge may hold key for near-term
- Silver trading around 2003 trend-line
For the intermediate-term technical outlook and expected fundamental drivers in the months ahead, check out the DailyFX Q3 Gold Forecast.
Gold & silver oversold, but have an uphill battle
In recent webinars we’ve been discussing oversold conditions in gold and silver, but even with these conditions present it isn’t making for a strong backdrop to mount a strong recovery from. Can they gain traction in the days ahead, or will price correct through time (move horizontally before lower)?
It’s a tricky spot for traders – seemingly too far down in the hole to initiate shorts with good risk/reward, but so far failing to inspire much buying interest to want to establish an aggressive long. There is a set-up developing on the 4-hr time-frame which may help establish a course for would-be longs.
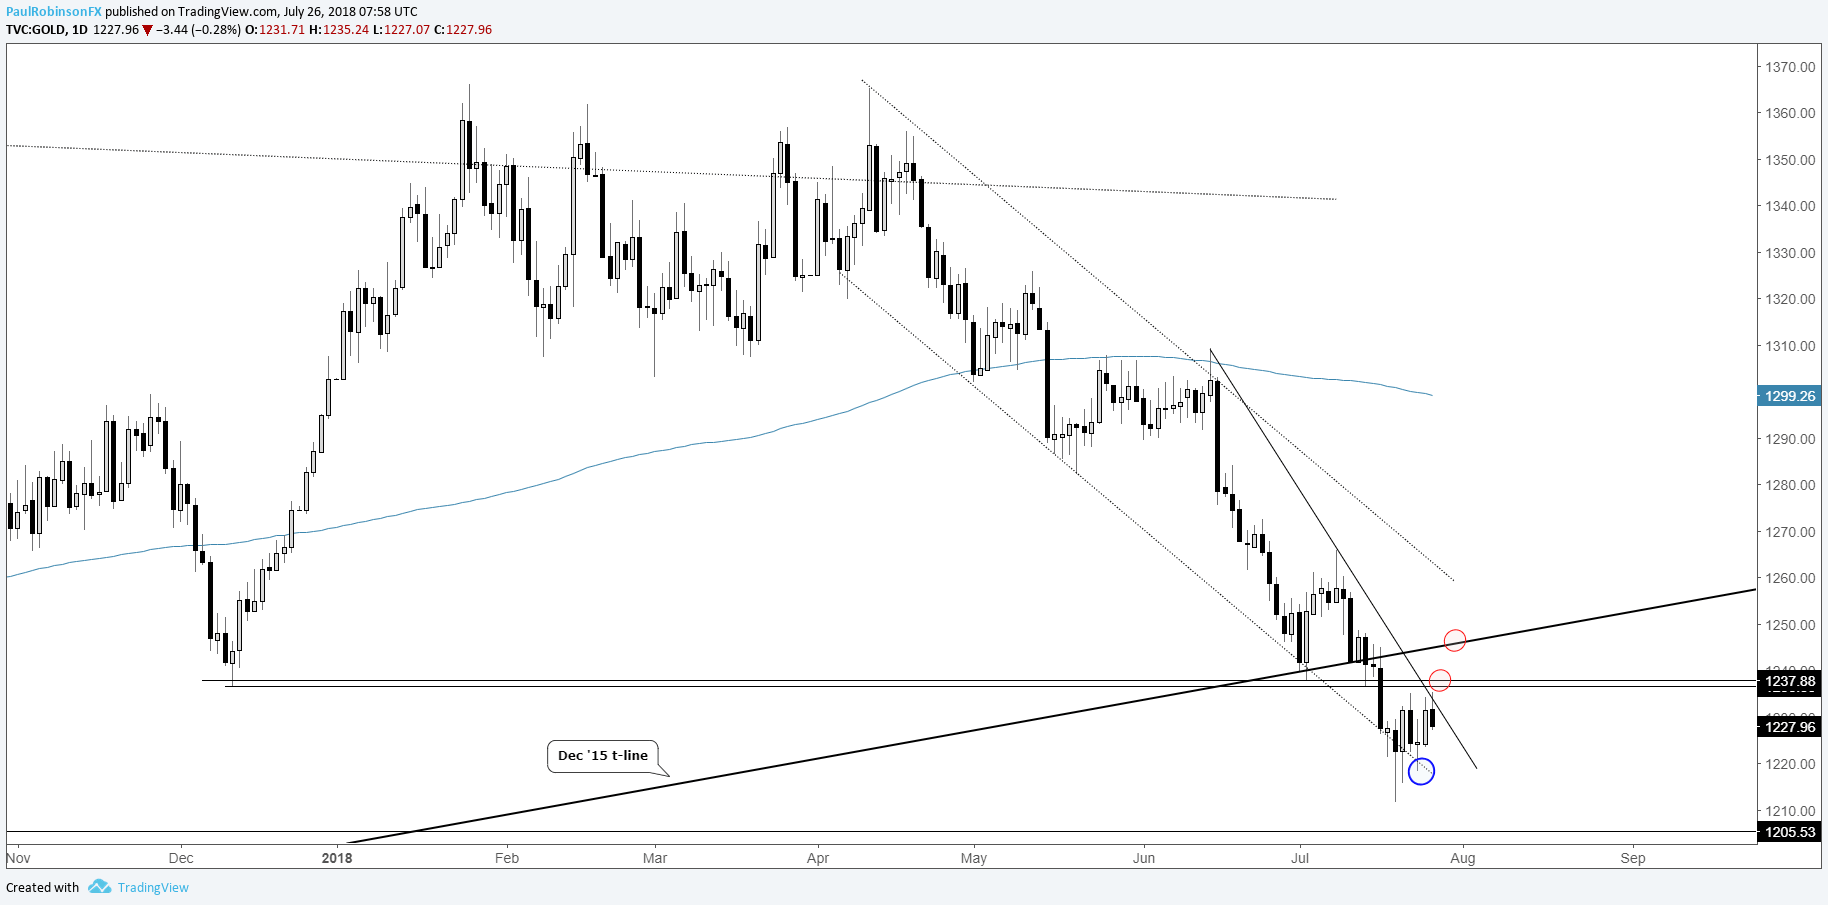
An ascending wedge is coming into view right at a trend-line from mid-June. The caveat is that it comes just beneath the lows from December and earlier this month around the 1238-line. And just beyond the Dec low a retest of the broken December 2015 trend-line, currently in the mid-1240s, could develop. So, though a bullish breakout from the wedge may occur soon, gold won’t be without its obstacles to climb over.
A couple of scenarios for those looking for another leg lower. First, the ascending wedge (while tilting bullish now with its higher lows) may break to the downside, leading to another leg lower. If this is the case, then we’ll be targeting the 1212/1205 region. The second would be to see high a push into the aforementioned resistance levels (especially a retest of the broken 2015 trend-line) plays out, as a touch and rejection could provide a favorable risk/reward profile.
Gold traders remain long by a hefty margin of 5-1; check out the IG Client Sentiment page for details as to why this is a headwind for higher prices.
Gold Daily Chart (Resistance levels ahead)
Gold 4-hr Chart (Ascending wedge forming)
Silver is currently trading under the 2003 trend-line on a daily and weekly basis (just touched it in overnight trade), but could still recoup it on a monthly closing basis. Given it is a 15-yr trend-line, seeing a close below on the long-term time-frame will be needed on this end to call it a confirmed break.
There looks to be even less hope for silver to bounce at the moment, but it is certainly oversold and underappreciated at the moment. A strong push through 15.65 will be needed to get things moving in the right direction (if you’re long), from there maybe a move up into the 16s can play out.
Silver Daily Chart (at 2003 trend-line, Dec low)

Resources for Forex & CFD Traders
Whether you are a new or experienced trader, we have several resources available to help you; indicator for tracking trader sentiment, quarterly trading forecasts, analytical and educational webinars held daily, trading guides to help you improve trading performance, and one specifically for those who are new to forex.
---Written by Paul Robinson, Market Analyst
You can follow Paul on Twitter at @PaulRobinsonFX


