


Gold/Silver technical highlights:
- Gold running lower into big long-term support, underside of wedge
- Silver breaking out of a triangle, 2003 trend-line in view
Traders are nearly 6-1 long gold, check out the IG Client Sentiment page to see how this acts as a contrarian indicator.
Gold running lower into big long-term support, underside of wedge
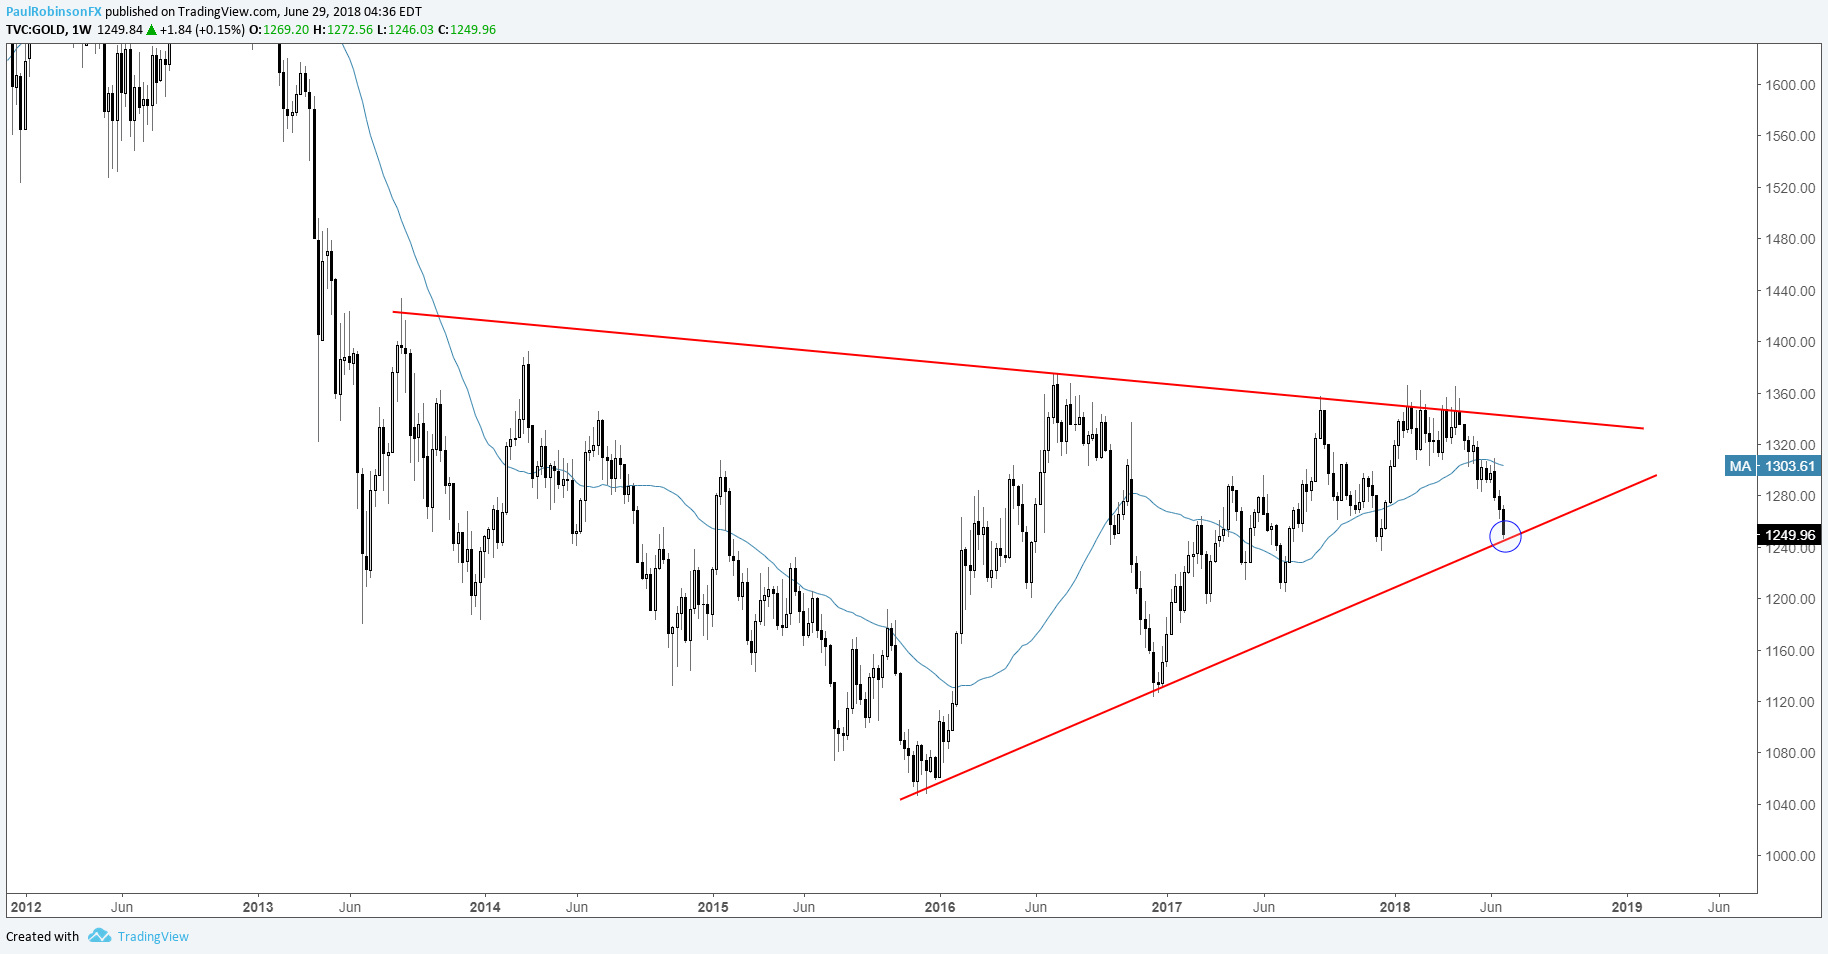
The move lower in gold hasn't disappointed with its impressive momentum after an extended period of choppy trading. A crossroad is nearing as price continues to unravel, with the December 2015 trend-line less than 10 handles or so below. This line also constitutes the underside of a long-term wedge.
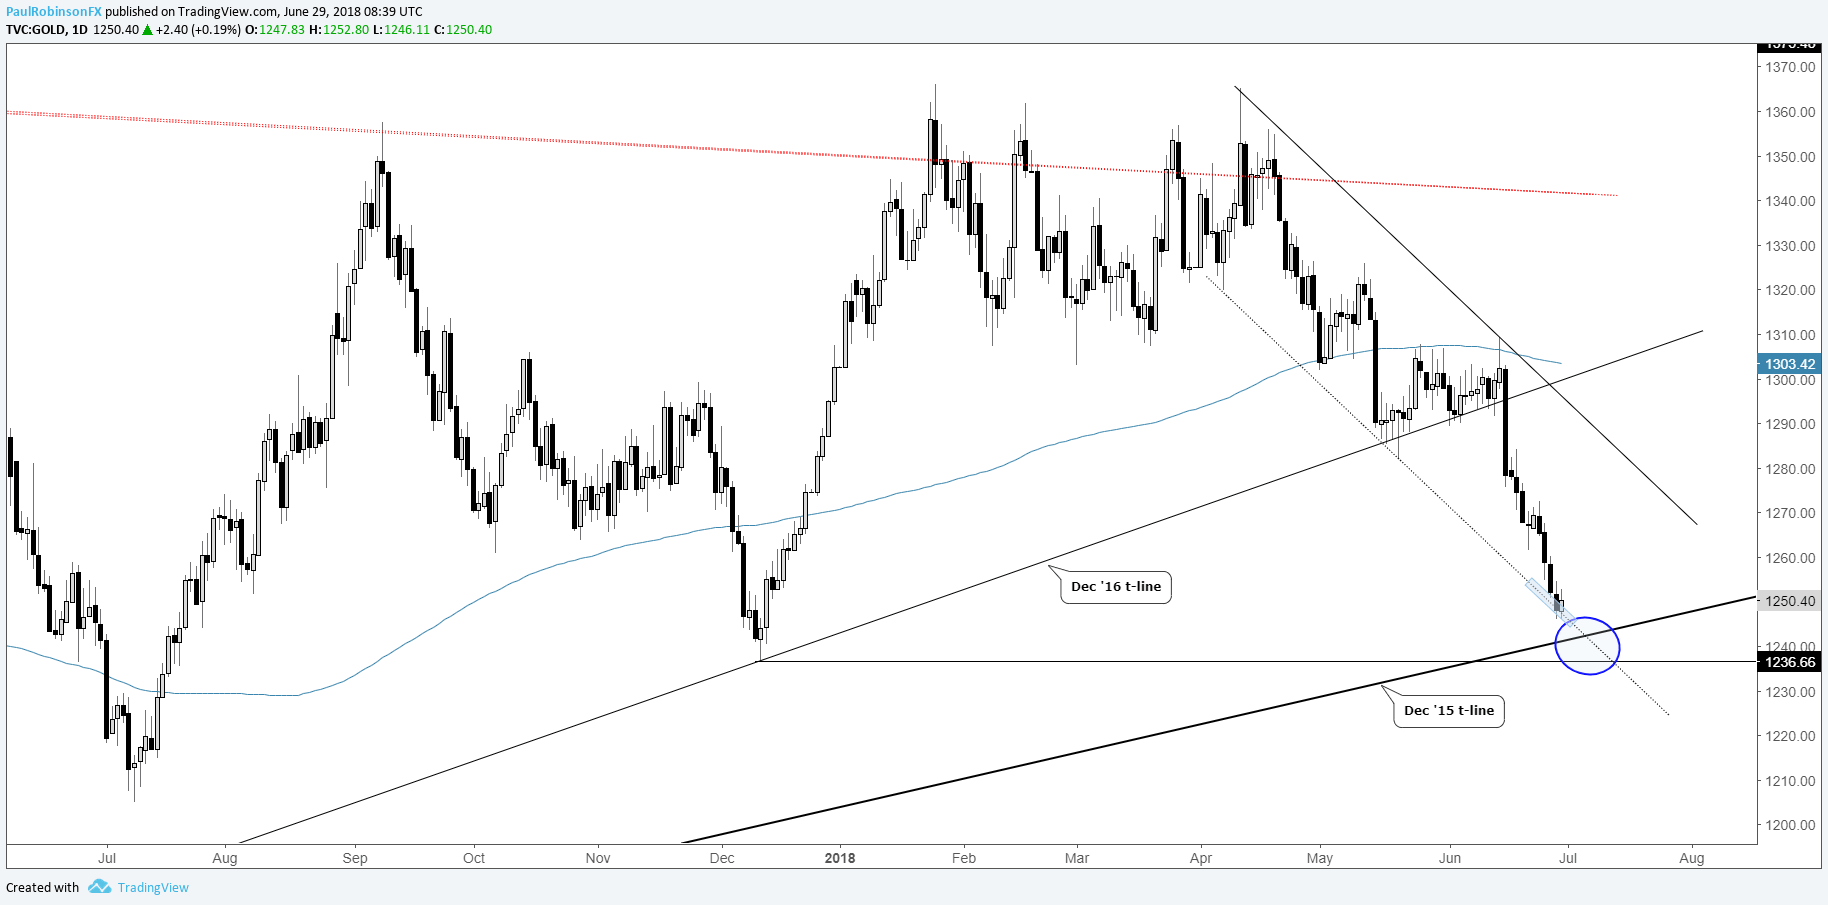
In relative confluence with the December 2015 trend-line is the low from December. This could make for a spot where price action becomes volatile as an oversold market meets major support. The thinking on this end, is that at the least a bounce develops, even if gold is to eventually continue trending lower.
Gold Weekly Chart (Long-term Wedge)
Gold Daily Chart (Big trend-line coming up)
For longer-term trading ideas, forecasts, and a library of educational content, check out the DailyFX Trading Guides.
Silver breaking out of a triangle, 2003 trend-line in view
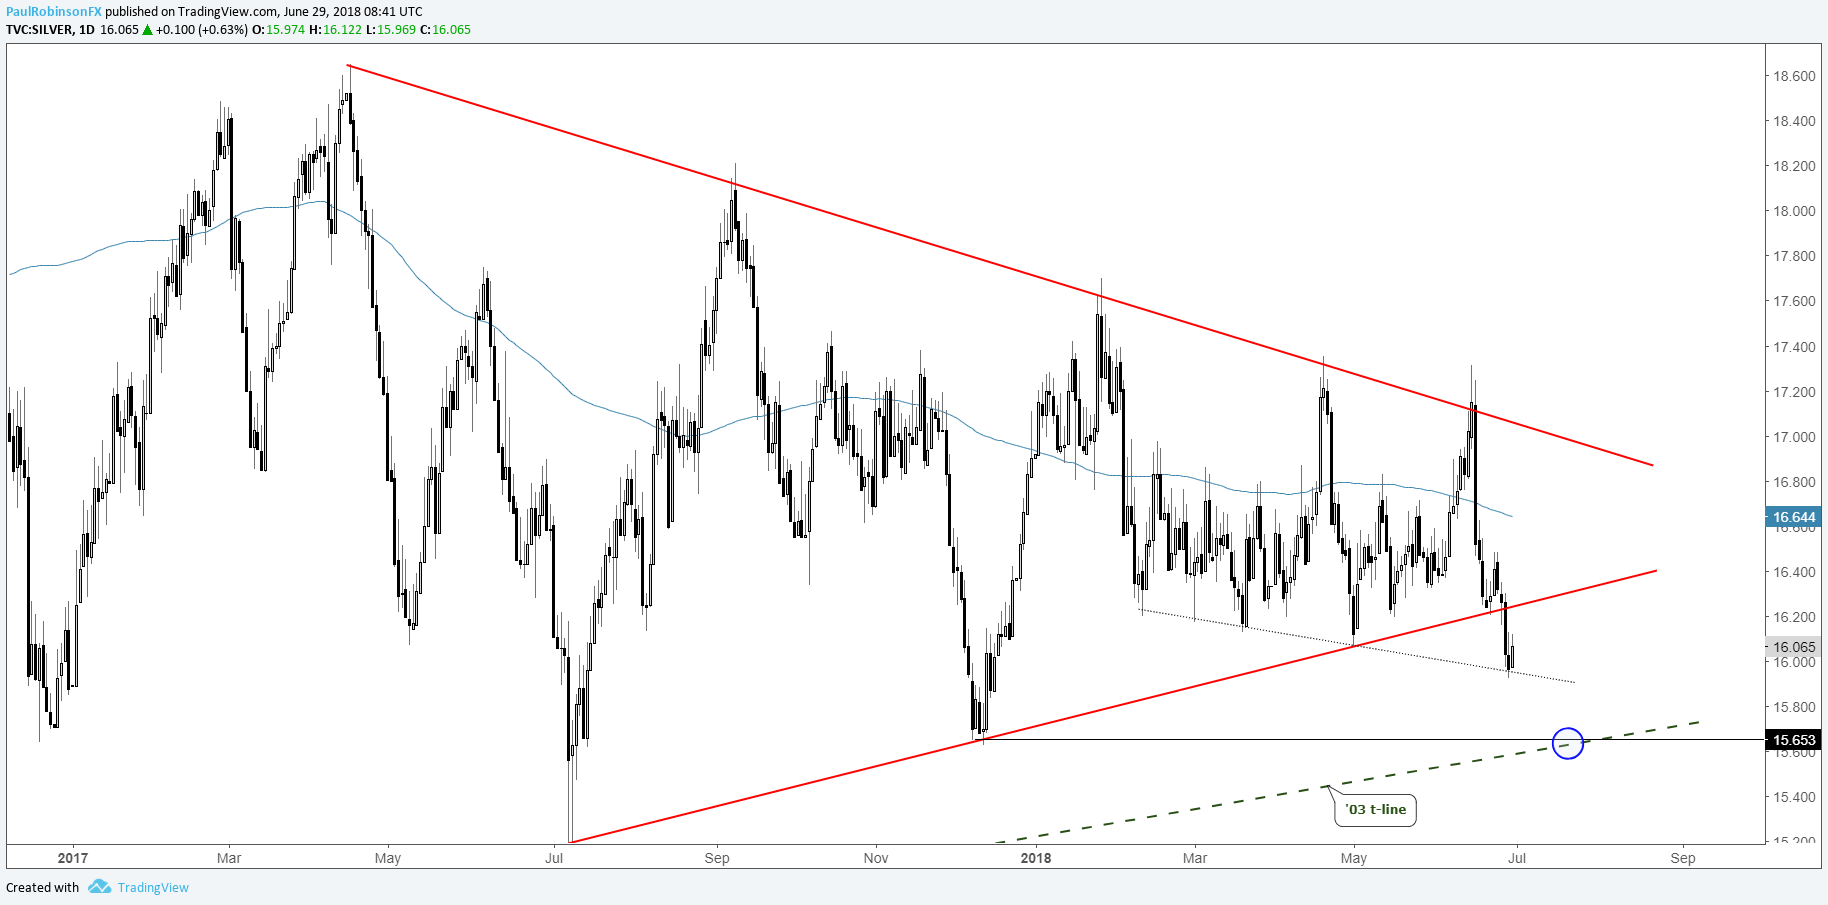
During the past couple of sessions silver slipped below trend-line support from July of last year, which also makes up the bottom of a wedge under construction for just as long. The break of the wedge on a weekly chart has silver geared up for more weakness, but selling may be curtailed by the fact that an even more important long-term trend-line rising up from 2003 isn’t too far below.
In confluence with the 15-year trend-line is the low from December. From a tactical standpoint, there is more room to go for shorts before support is met, but a big bounce may ensue once reached. At this time, the long-term trend-line is not necessarily a great spot to establish a fresh long, but is reason to be cautious on existing bearish wagers once met.
Silver Daily Chart (Triangle broken, 2003 trend-line in focus)
Resources for Forex & CFD Traders
Whether you are a new or experienced trader, we have several resources available to help you; indicator for tracking trader sentiment, quarterly trading forecasts, analytical and educational webinars held daily, trading guides to help you improve trading performance, and one specifically for those who are new to forex.
---Written by Paul Robinson, Market Analyst
You can follow Paul on Twitter at @PaulRobinsonFX


