


Gold/Silver technical highlights:
- Silver rallying, but has obstacles standing in the way
- Gold is winding up via a triangle between major levels
Traders are 4-1 long gold, check out the IG Client Sentiment page to see how this acts as a contrarian indicator.
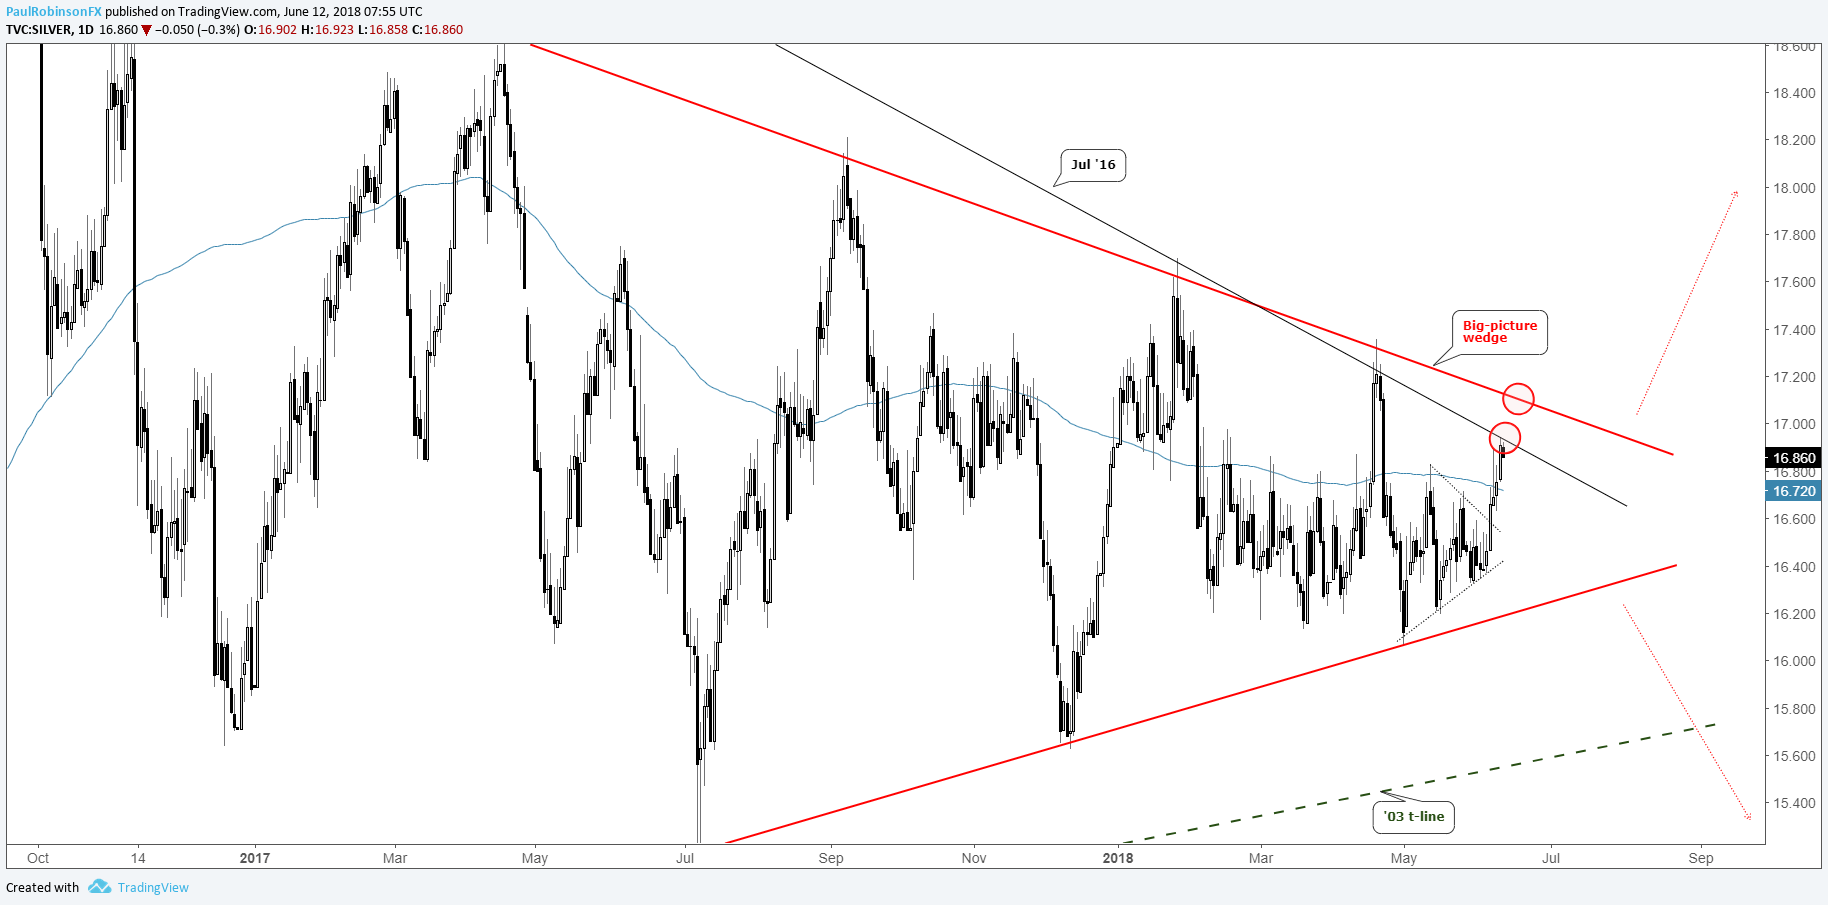
Silver rallying, but has obstacles standing in the way
Silver has been on the move higher, rallying from a month-long triangle, but it hasn’t been an easy market to trade despite the one-way move. Even though it’s been a fairly straight line up the past few sessions.
Standing in the way was the 200-day MA and the area around the 16.80s, and now the July 2016 trend-line. Not far beyond that trend-line lies another trend-line from April of last year, which happens to also constitute the top of a much larger wedge pattern.
It would be unsurprising with the choppiness we’ve seen and ongoing wedge, for silver to soon fall apart from one of the aforementioned obstacles just as it did in April. Tough times to be a precious metals trader. The good news is, tough times are followed by the good (that is, a solid, clear directional move).
Gold’s technical outlook could be very telling for silver in the days ahead…
Silver Daily Chart (Rally has obstacles)
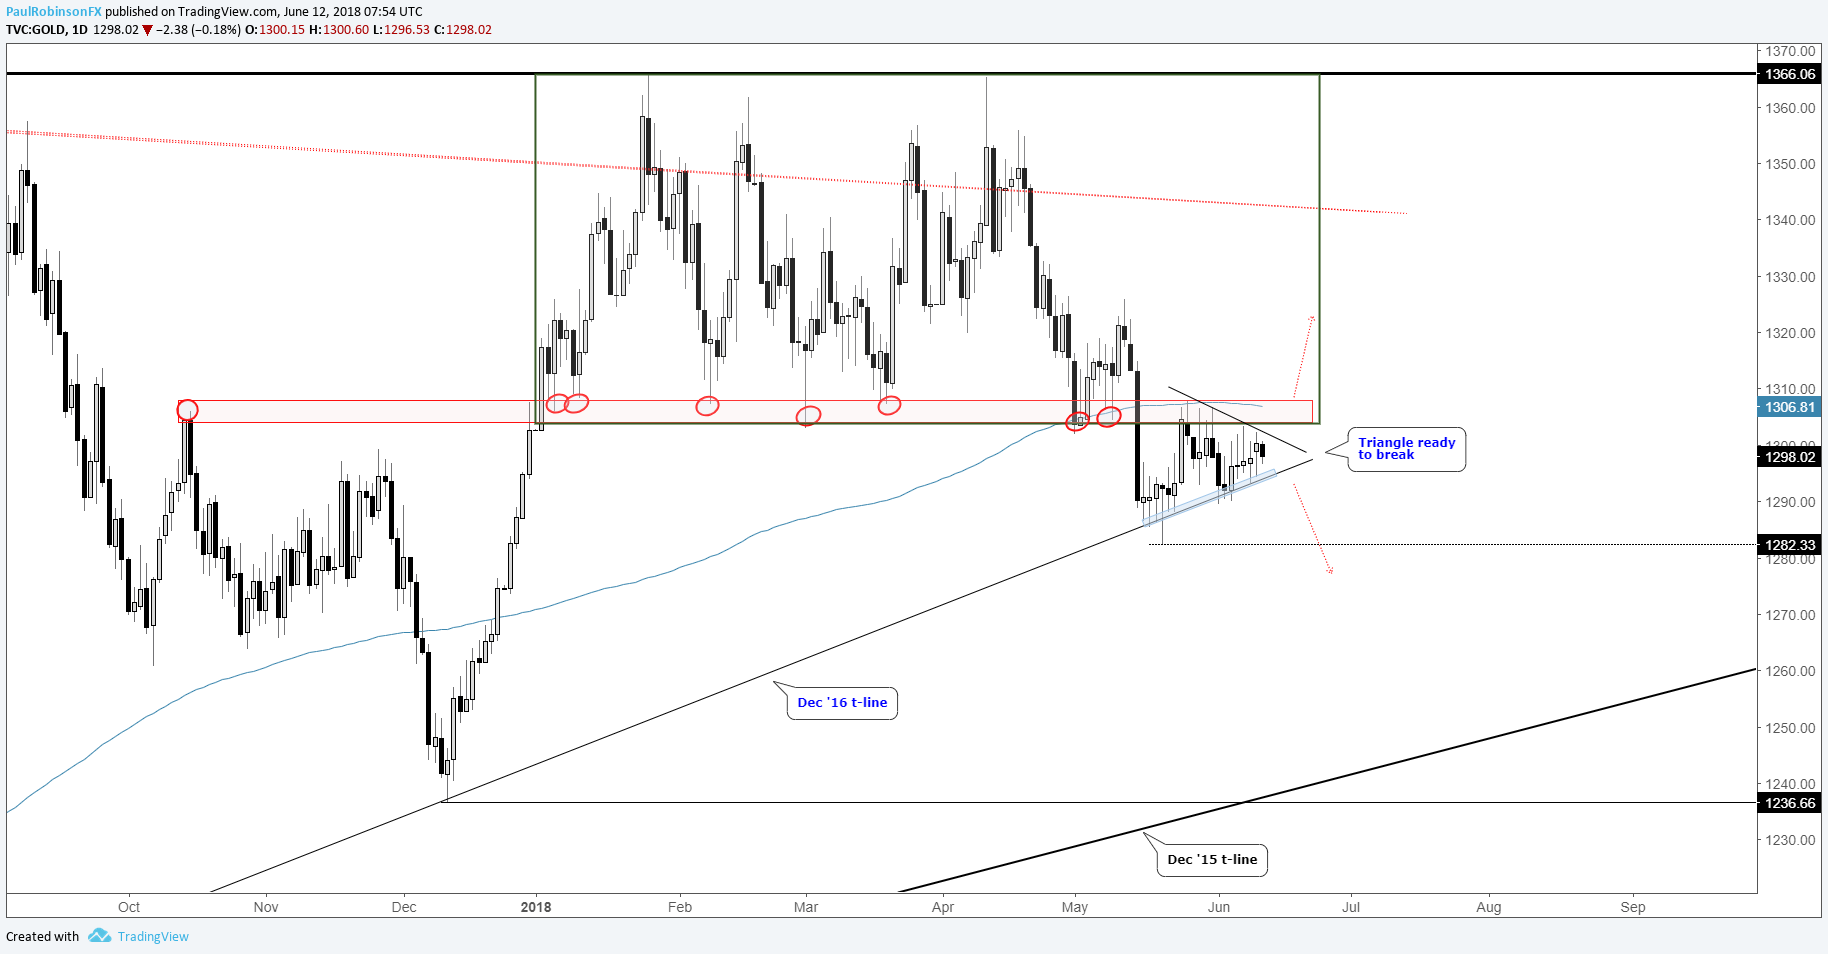
Gold is winding up via a triangle between major levels
The trading in gold is getting increasingly difficult as a triangle since last month continues to build. It’s appearance comes at an interesting spot – between the December 2016 trend-line and below the range which dominated much of the year’s trade.
A breakout should be on its way any time now. Will it be the way of silver, or will it break down? A downside breakout is still the preferred path given the lack of levels to the left on the chart to contend with. A top-side break will put gold back inside the thicket of the range and will perhaps make for a more difficult trade.
In any case, we’re due for a directional move, so traders shouldn’t have to wait long for trading conditions to improve.
Gold Daily Chart (Triangle to break soon)
For the intermediate-term fundamental/technical outlook, check out the Gold Forecast
Resources for Forex & CFD Traders
Whether you are a new or experienced trader, we have several resources available to help you; indicator for tracking trader sentiment, quarterly trading forecasts, analytical and educational webinars held daily, trading guides to help you improve trading performance, and one specifically for those who are new to forex.
---Written by Paul Robinson, Market Analyst
You can follow Paul on Twitter at @PaulRobinsonFX


