


Gold/silver technical highlights:
- Gold checked at resistance again, big support in view
- Silver turns from its own zone of resistance, ~16 important support
Start tracking DailyFX analysts’ Top Trading Opportunities for 2018 by visiting the DailyFX Trading Guides page.
Gold checked at resistance again, big support in view
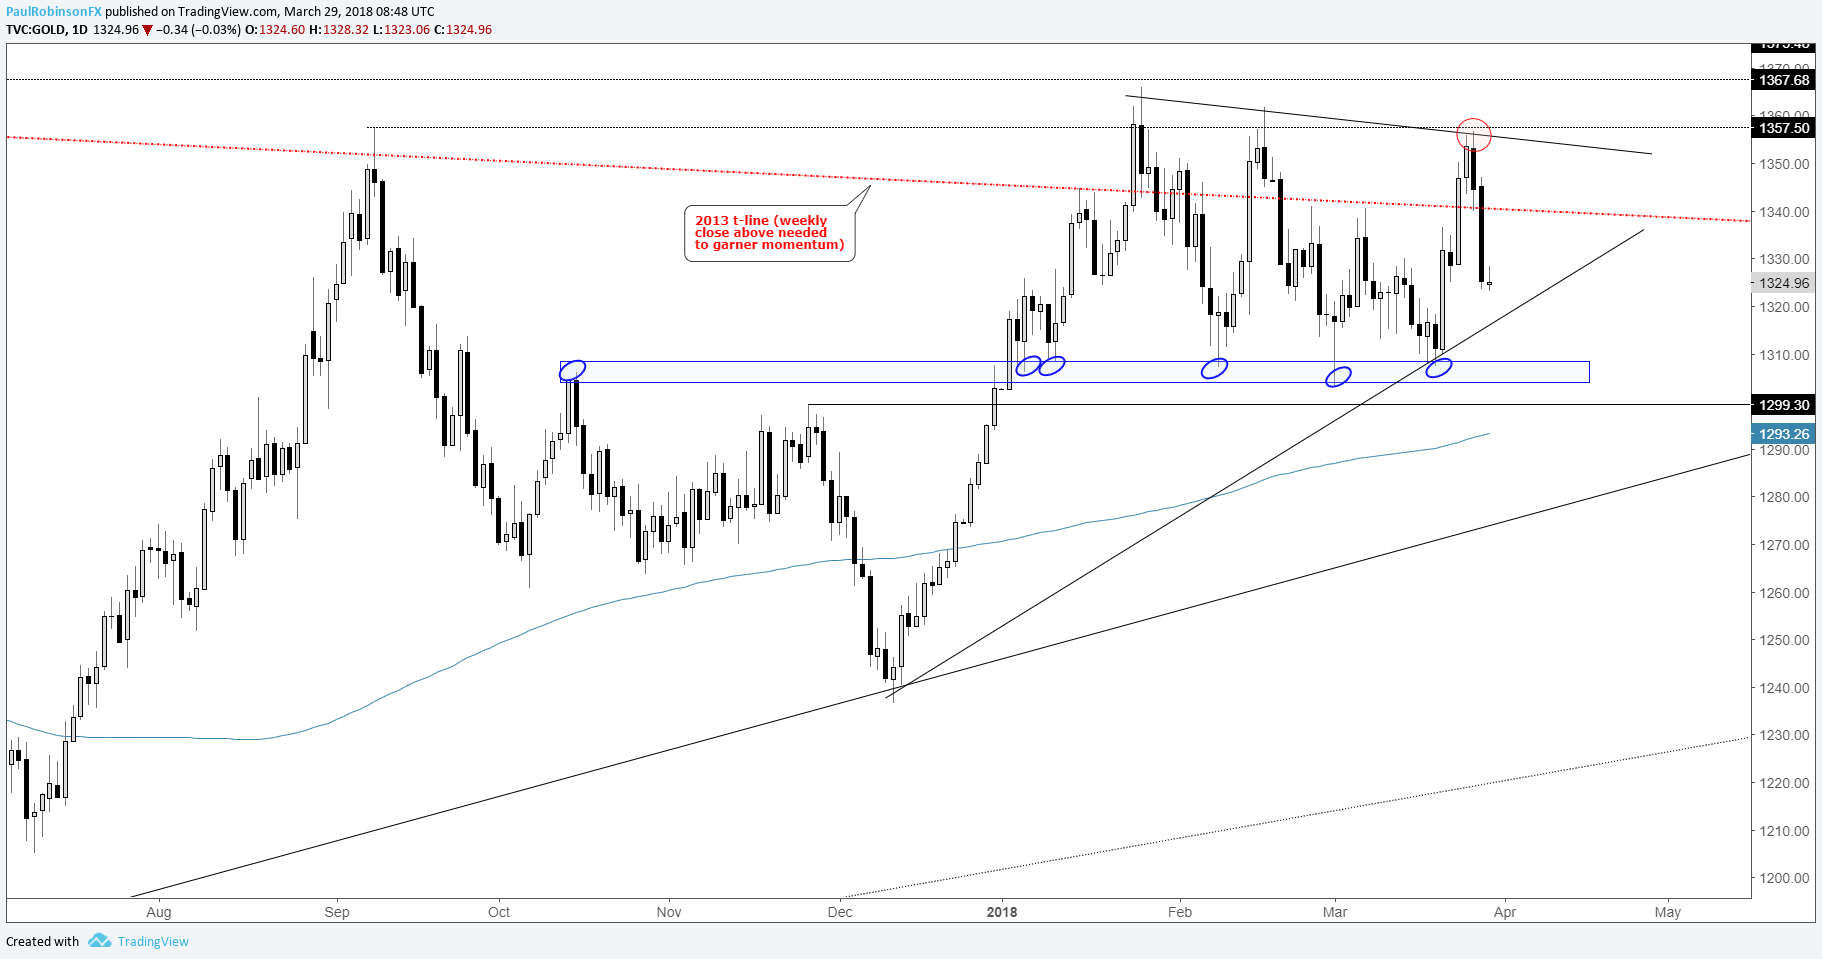
Last week, when we took a look at gold this is what we had to say: “Start watching how any follow-through maintains should it start trading up into the 1340/60 zone. This could quickly become another reversal point as it has on other occasions since January.”
Indeed, gold reversed sharply from the noted zone. The 2013 trend-line continues to be extremely difficult, and as long as gold can’t rise above on a weekly closing basis it will remain a focal point for sellers.
The sharp drop has strong support just above 1300 already in view, but we may see a bounce first around a trend-line dating back to December. If the decline can halt prior to reaching to the zone around 1300, it could be a sign of strengthening with a higher-low. But again, until we see that weekly close above the 2013 trend-line the 1340/60-area will remain viewed as a point of interest for sellers.
To see how traders are positioned in gold and other key markets, check out the IG Client Sentiment page.
Gold Daily Chart
Gold Weekly Chart

Silver turns from its own zone of resistance, ~16 important support
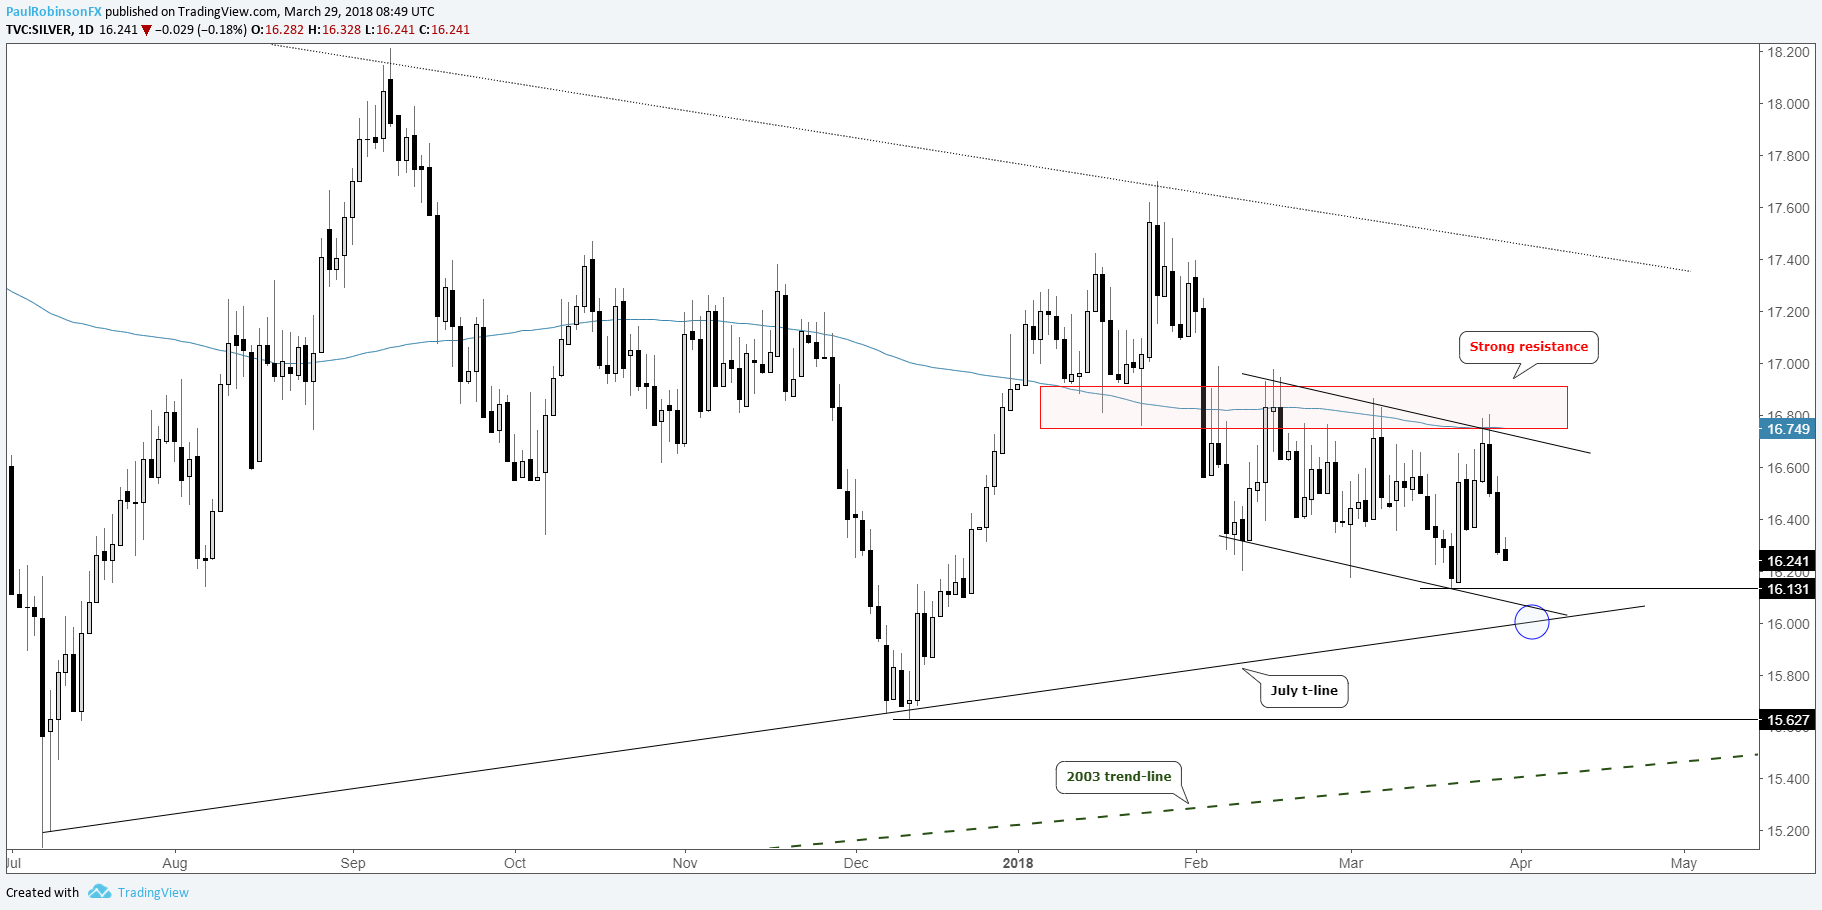
Silver turned down from the 16.70/17 resistance zone, again. The 200-day MA runs right through the thick of resistance, adding further reinforcement. Support is just a stone’s throw away at 16.13 down to the July trend-line right around the 16-mark. Also, in the vicinity lies the lower parallel of the downward sloping channel in place since early February.
If silver breaks 16 with authority, there isn’t any notable support until the December low at 15.62. It’s a little premature to discuss at this juncture, but below the December low lies a trend-line rising up from 2003, this would certainly be a huge spot.
But for now, we’ll keep a close eye on how price action plays out around 16, and if it can lead to enough support for a bounce. Keep an eye on the aforementioned levels in gold, too, as an indication as to how the current down-move might play out in silver.
Silver Daily Chart
Resources for Forex & CFD Traders
Whether you are a new or experienced trader, we have several resources available to help you; indicator for tracking trader sentiment, quarterly trading forecasts, analytical and educational webinars held daily, trading guides to help you improve trading performance, and one specifically for those who are new to forex.
---Written by Paul Robinson, Market Analyst
To receive Paul’s analysis directly via email, please SIGN UP HERE
You can follow Paul on Twitter at @PaulRobinsonFX


