


Highlights:
- Gold breaks above 2013 trend-line, nudges above 2017 high
- Silver runs through thick resistance via trend-line, price zone
- A pause would do them good before trying to further rally
For longer-term fundamental and technical analysis for Gold and other major markets, see the Q1 Trading Forecasts.
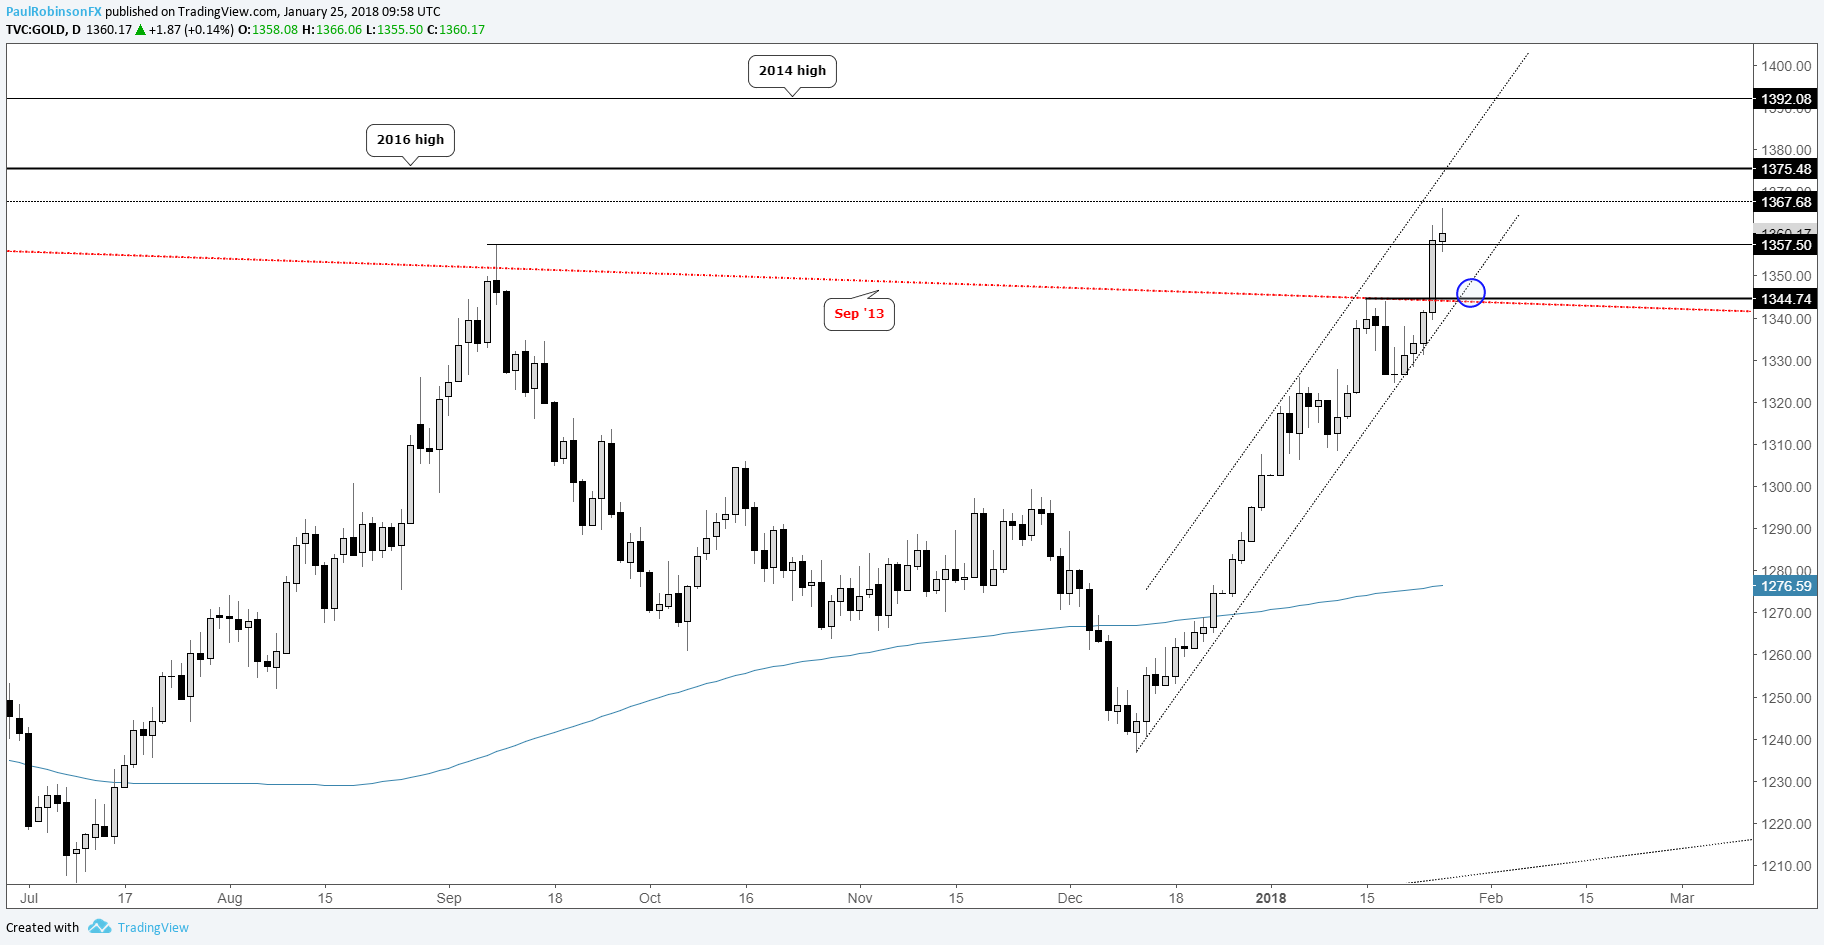
Gold breaks 2013 trend-line, 2017 high
Yesterday was a big day for precious metals, with the help of a sharply declining US dollar. Gold broke through the 2013 trend-line we’ve been discussing lately, and even took out the 2017 high at 1357 in the process (albeit on a closing basis, marginally).
This opens up a path to the 2016 high at 1375, with resistance standing in the way at 1367 (came close overnight). Beyond the 2016 high is the 2014 high, which clocks in at 1392. From a tactical standpoint, despite gold having broke out, the current extension doesn’t offer the greatest risk/reward long.
A modest pullback not exceeding the recently broken 2013 trend-line (~1343) may present an opportunity for would-be longs. Prior to that, gold has a trend-line from the December low. A small consolidation-phase without seeing much of a retracement would give gold a chance to build up steam for another push higher. Until we see a sharp reversal in price action, back below the 2013 trend-line, shorts don’t appear appetizing at this time.
Check out this guide for ideas on Building Confidence in Trading
Chart 1 – Gold: Daily
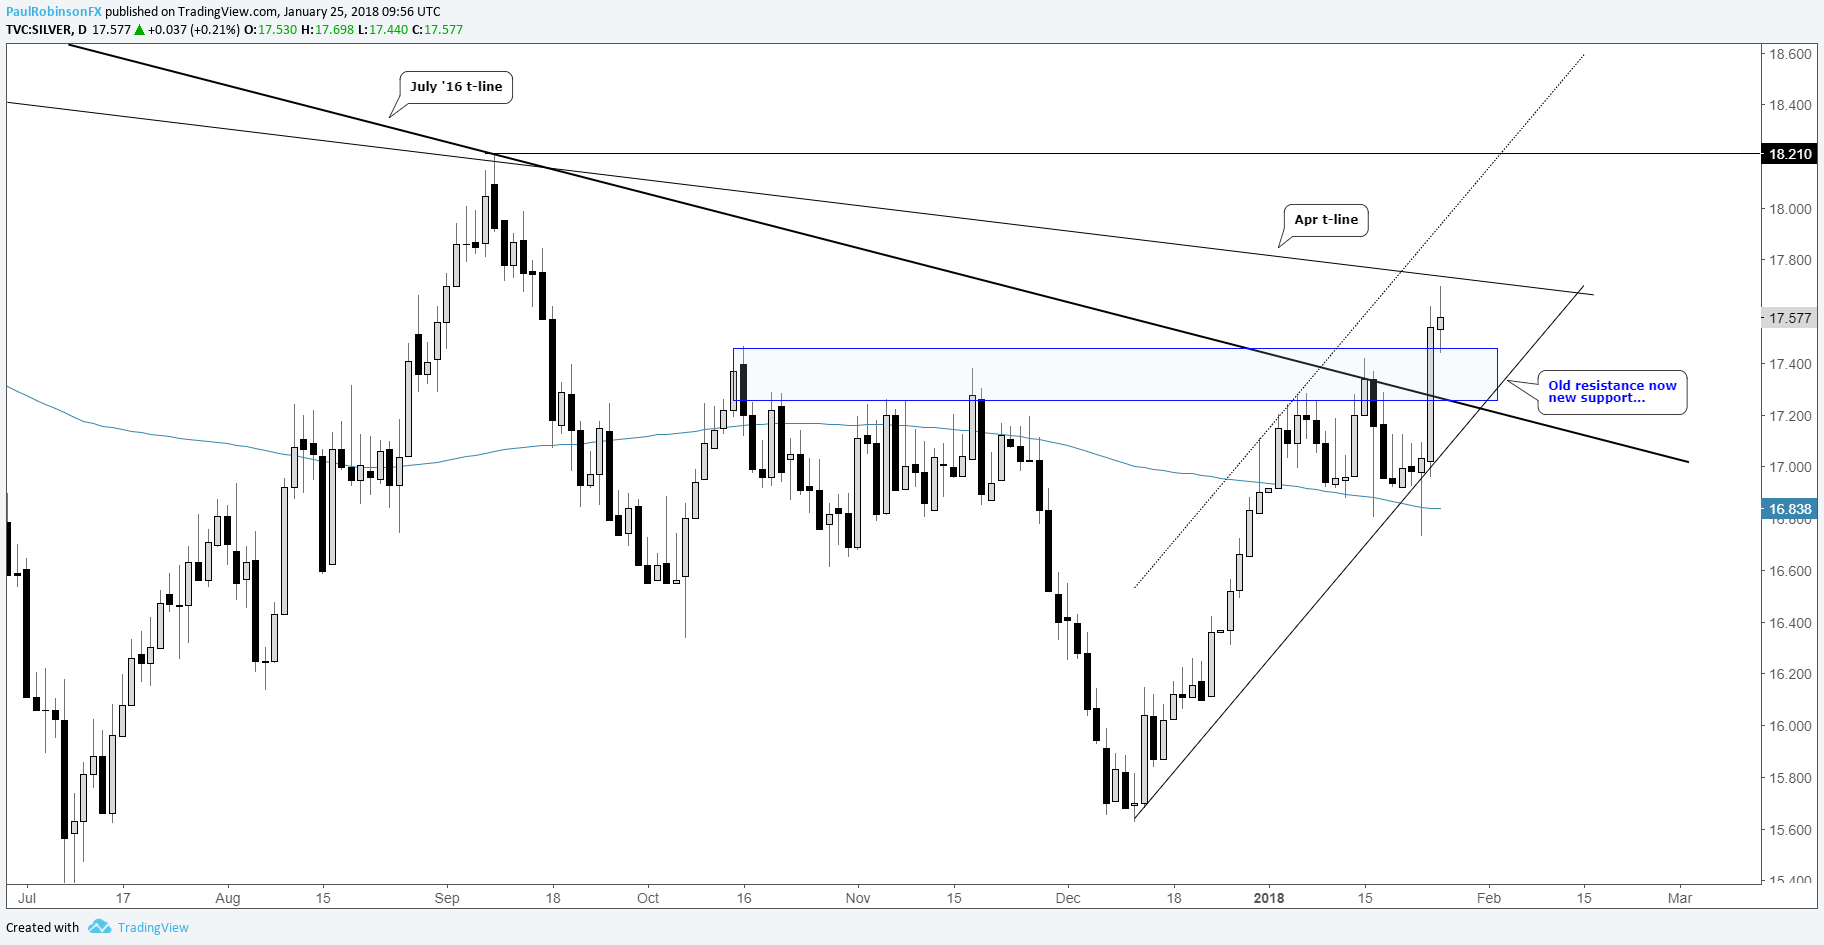
Silver runs through thick resistance via trend-line, price zone
Silver has been lagging behind gold, but made a major ‘catch-up’ move yesterday, rallying about 3% through a thicket of resistance in the vicinity of 17.25/40, along with crossing the 2016 trend-line which ran through the vicinity of price resistance.
Just ahead lies a trend-line crossing down from April over the September peak (today’s high, depending on how you draw it, touched the t-line). This will be the first line to hurdle before the next price level of price resistance clocks in at 18.21. Looking to support, the recently broke resistance in the 17.25-40 range turns into the first area to watch. A breakdown back below and the trend-line rising up from December would be cause for pause on a further advance.
Chart 2 – Silver: Daily
Trader Resources
Whether you are a new or experienced trader, we have several resources available to help you; indicator for tracking trader sentiment, quarterly trading forecasts, analytical and educational webinars held daily, trading guides to help you improve trading performance, and one specifically for those who are new to forex.
---Written by Paul Robinson, Market Analyst
To receive Paul’s analysis directly via email, please SIGN UP HERE
You can follow Paul on Twitter at @PaulRobinsonFX


