


What’s inside:
- Silver prices continue to digest recent gains
- A couple of scenarios are on the table within the ‘chop’
- These scenarios may not provide a proper trigger, but having them drawn up offers a game-plan
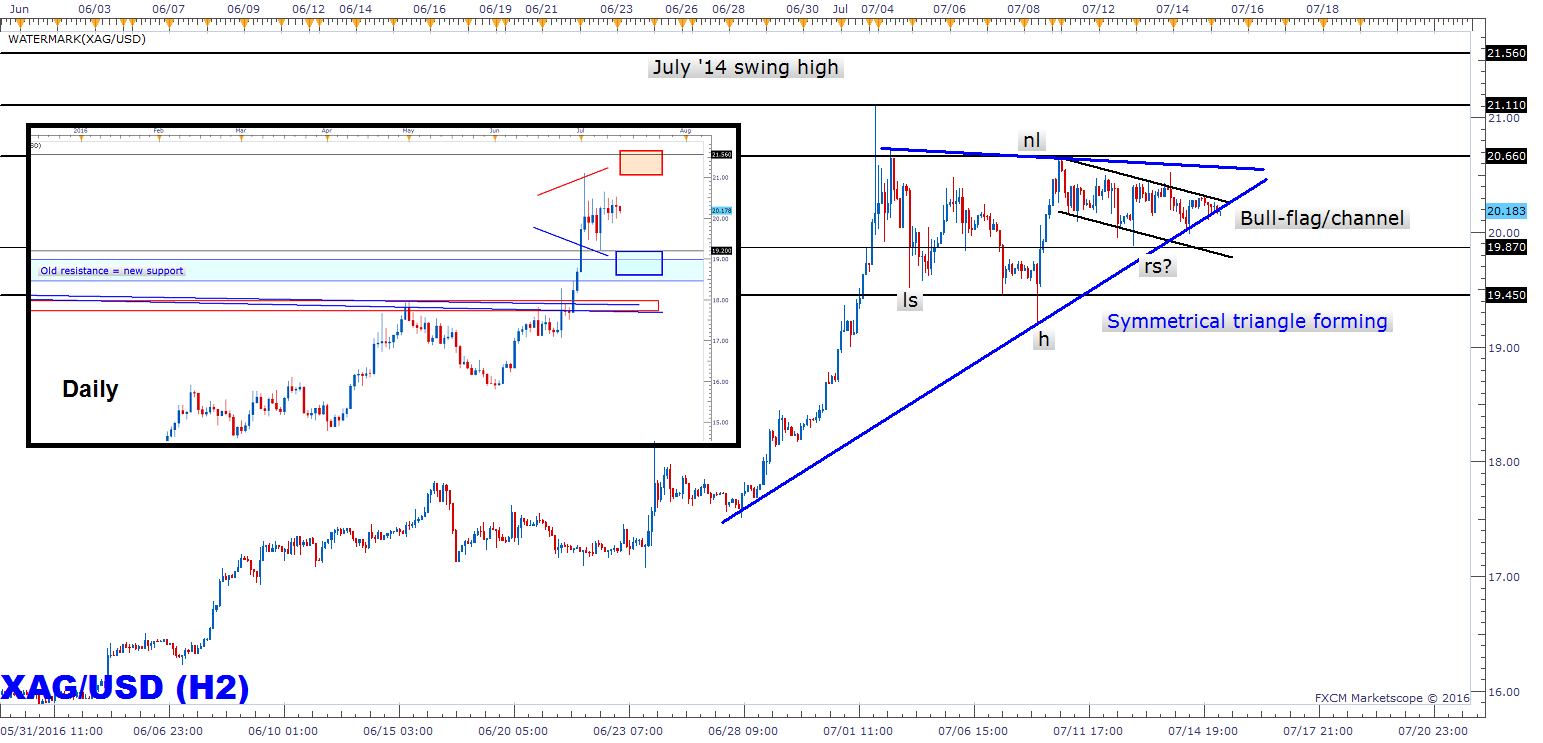
Silver is showing us what trying to make heads or tails of a choppy range following a spike can be like – difficult. The other day we made mention of two possible scenarios developing on the 1-2 hour time-frame. While the one is still on the table – continuation-style inverse H&S – the other – an ascending wedge – is quickly fading.
Price action since the spike high at the very beginning of the month is now taking the shape of a symmetrical triangle (which could still be viewed as an inverse H&S). Which way will it break? If in fact it even comes to form we will have to let the market tell us; either it breaks the upper trend-line or the lower. A bull-flag/channel has developed within the confines of the narrowing range as well.
It is quite possible the choppiness doesn’t form any kind of discernable pattern which triggers. But it never hurts to have scenarios drawn up in the event one of them comes to fruition and offers a trade.
If silver takes out the top-side trend-line and a move to the 21.11 high and higher becomes a likely outcome. If that is the case, then we will look to around 21.60 (a key swing high created almost exactly 2 years ago) as resistance.
Clear the bottom-side trend-line with conviction, then the 19.45/25 area becomes the first focal point of support, with sub-19 in the cards on a retest of the major zone of support which runs back to lows in 2013/14 and the 2015 high.
Follow sentiment in real-time via the DailyFX SSI indicator.
---Written by Paul Robinson, Market Analyst
You can follow Paul on Twitter at @PaulRobinsonFX.


