


Crude Oil Price Forecast Overview:
- Crude oil prices have been climbing alongside improved risk appetite, but gains may prove limited as production comes back online.
- The ongoing tug-and-pull between the global economic recovery and the supply-demand deficit remains the prevailing overarching theme guiding energy markets.
- Recent changes in retail trader positioning gives us a neutral bias towards crude oil prices.
Crude Oil Prices Flag After Breakout
Crude oil prices are posting meager gains following yesterday’s bullish outside engulfing bar on the daily chart, occurring in the middle of a flag pattern following the recent breakout higher in prices.
But even with a strong technical push to the topside, crude oil prices find themselves struggling outside of their recent range (or descending channel, depending upon your perspective). It would be naïve for traders, even the most technically-inclined, to ignore the ongoing tug-and-pull between the global economic recovery and the oil supply-demand deficit, which remains the prevailing overarching theme guiding energy markets.
Sticking to the Crude Quarterly Forecast
The end of Q4’20 brings about greater optimism for the global economy and energy markets, especially now that a coronavirus vaccine is on the verge of distribution in developed Western economies. Persistent efforts through 2020 to curate a supply-demand deficit have kept crude oil prices buoyed.
But news from OPEC+ that 500K barrels per month in production will come back online suggests that producers aren’t willing to let energy prices run too high lest they run the risk of losing market share to other competitors who bring production online sooner. In other words, significant overhead supply exists in oil markets – crude, Brent, natural gas, etc.
We thus stick to our fundamental forecast of Q3’20 and Q4’20 as we near the end of 2020, which was calling for crude oil prices to stay elevated between $35 and $50 per barrel. It still holds that “the supply-demand shifts are a strong fundamental force that is the dominating market factor…were crude oil prices to rise beyond $50 per barrel, it would be highly likely that US shale producers would come back online, bring more supply back into the mix.”

Oil Volatility Slumps, Oil Prices Inch Higher
Crude oil prices have a relationship with volatility like most other asset classes, especially those that have real economic uses – other energy assets, soft and hard metals, for example. Like how bonds and stocks don’t like increased volatility – signaling greater uncertainty around cash flows, dividends, coupon payments, etc. – crude oil tends to suffer during periods of higher volatility.
Heightened uncertainty in financial markets due to increasing macroeconomic tensions decreases theoretical demand for energy; signs that the global economy is recoveing from the coronavirus pandemic reduces uncertainty, as does hope for a new US fiscal stimulus package.
Read more: How Do Politics and Central Banks Impact FX Markets?
OVX (Oil Volatility) Technical Analysis: Daily Price Chart (December 2019 to December 2020) (Chart 1)
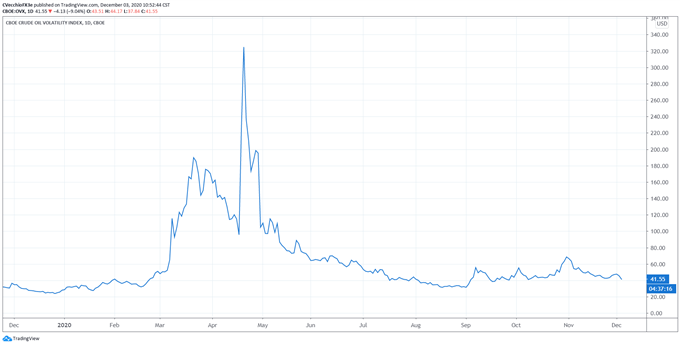
Oil volatility (as measured by the Cboe’s gold volatility ETF, OVX, which tracks the 1-month implied volatility of oil as derived from the USO option chain) was last spotted trading at 41.55, well off of its all-timeabsolute high set on April 21 at 517.19, and still considerably below the all-time closing high (also established on April 21) at 325.15. Oil volatility is back at levels seen throughout 2019; the situation appears to be stable (as has been the case since June).
The 5-day correlation between OVX and crude oil prices is -0.61 while the 20-day correlation is -0.78; and one week ago, on November 25, the 5-day correlation was -0.60 and the 20-day correlation was -0.92. If it’s typical to see oil volatility and oil prices share an inverse relationship, it would appear that this sense of normalcy has returned for some time: the 20-day correlation has been -0.70 or lower since August 12.
Crude Oil Price Technical Analysis: Daily Chart (December 2019 to December 2020) (Chart 2)
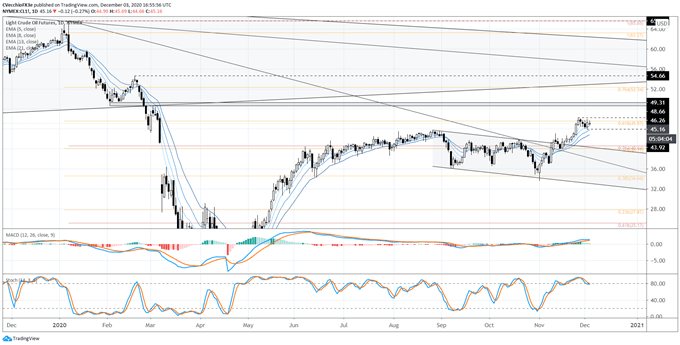
Crude oil prices are flagging after their bullish breakout from the August to November range/descending channel, and the range distance measured from the breakout point suggests that the upside target may have been reached. To this end, while a short-term technical view may dictate higher prices, failure below the early-December low of 43.92 would suggest that the upside move has already been exhausted.
The outcome of the struggle crude oil prices are enduring will ultimately shape the next directional move.
If crude oil prices were to make any more gains, breaching 46.26 could trigger what could be a quick trip higher into the area between 48.66 and 49.31, which proved to be a meaningful turning point in February and March during the initial coronavirus pandemic selloff. Coupled with the knowledge that significant overhead supply sits on the sideline, any gains into the 48.66 and 49.31 would be seen as the absolute point for profit taking for bulls.

IG Client Sentiment Index: Crude Oil Price Forecast (December 3, 2020) (Chart 3)
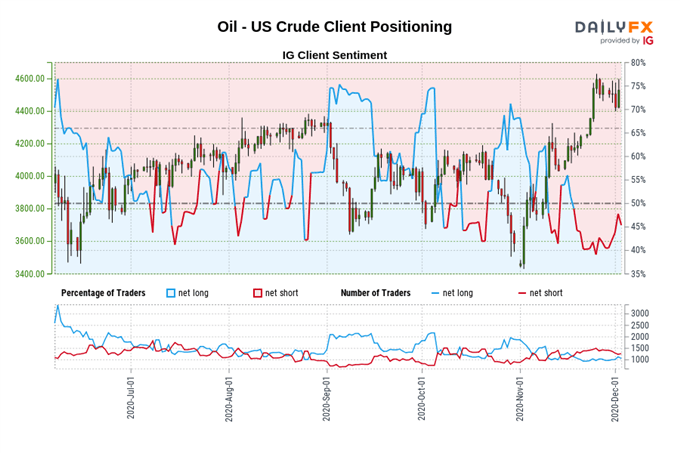
Oil - US Crude: Retail trader data shows 48.70% of traders are net-long with the ratio of traders short to long at 1.05 to 1. The number of traders net-long is 3.81% lower than yesterday and 13.81% higher from last week, while the number of traders net-short is 0.16% lower than yesterday and 10.92% lower from last week.
We typically take a contrarian view to crowd sentiment, and the fact traders are net-short suggests Oil - US Crude prices may continue to rise.
Positioning is more net-short than yesterday but less net-short from last week. The combination of current sentiment and recent changes gives us a further mixed Oil - US Crude trading bias.
--- Written by Christopher Vecchio, CFA, Senior Currency Strategist


