Crude Oil Highlights:
- WTI oil cratered through 2016 trend-line, near December 2018 low
- Brent oil trading around that 2018 low, a break to spell more trouble
WTI oil cratered through 2016 trend-line, near December 2018 low
The price of oil has been swinging around hard the past few sessions with nearly unprecedented volatility inflicting pain on the risk-trade, with stocks at the center of that. There are rate cuts for stocks and production cuts (potentially) for oil, but neither are likely to stem the tides of high volatility for the foreseeable future.
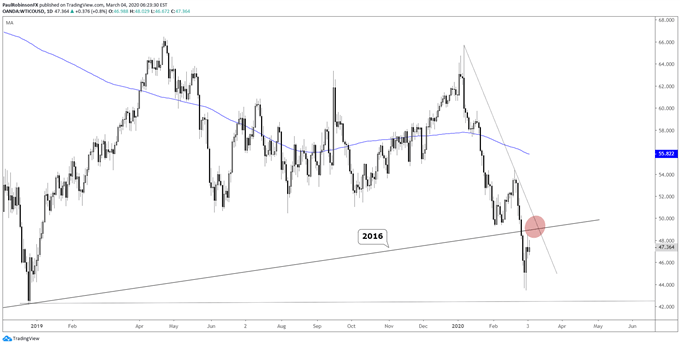
The 2016 trend-line that was recently broken is considered a significant form of resistance. There is a very steep trend-line running down off the January high that also runs in the vicinity of the 2016 iteration as well.
On a further weakness the December 2018 low will be targeted as support, when the risk-trade last came apart at the seams. It currently resides at 42.20. This may help put a floor in, but if it doesn’t then selling could become more aggressive.
Watch stocks closely. The low from Friday may have been the crescendo in fear for now, and further volatility and probing from here may be only a retest before the risk trade firms up. If this is the case, then oil may not come back strong, but will likely put in a respectable recovery. If the bounce in equities turns out to be only that, then look for the 42 level to get taken out. For now, with volatility so high the environment favors nimble short-term traders playing the back-and-forth swings.
WTI Crude Oil Daily Chart (2016 t-line above, Dec ’18 low below)

WTI Crude Oil Chart by TradingView
Trading Forecasts and Educational Guides for traders of all experience levels can be found on the DailyFX Trading Guides page.
Brent oil trading around that 2018 low, a break to spell more trouble
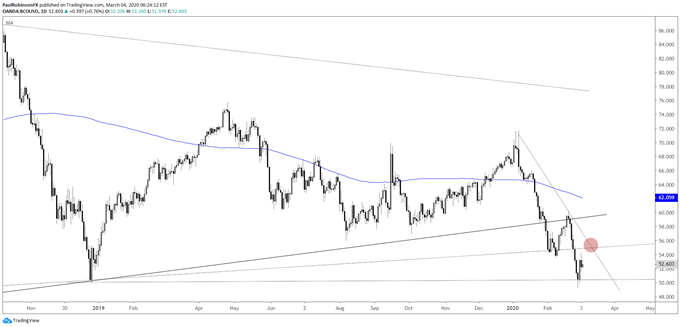
Brent crude has been trading weaker than its US counterpart, WTI, and on that it could continue to be the leader on the downside should another major wave of selling hit stocks, rates, and economically sensitive commodities. There is resistance around the trend-line off the January high and a slope from 2016 in the vicinity of 55. On the downside, 51.54 is the low from the other day to watch.
Brent Crude Oil Daily Chart (trading around Dec ’18 low)

Brent Crude Oil Chart by TradingView
***Updates will be provided on the above ideas as well as others in the trading/technical outlook webinars held at 1030 GMT on Tuesday and Friday. If you are looking for ideas and feedback on how to improve your overall approach to trading, join me on Thursday each week for the Becoming a Better Trader webinar series.
Resources for Forex & CFD Traders
Whether you are a new or experienced trader, we have several resources available to help you; indicator for tracking trader sentiment, quarterly trading forecasts, analytical and educational webinars held daily, trading guides to help you improve trading performance, and one specifically for those who are new to forex.
---Written by Paul Robinson, Market Analyst
You can follow Paul on Twitter at @PaulRobinsonFX


