


Crude Oil Highlights:
- WTI oil is trading at the trend-line off the 2016 low
- Brent oil is below the similar trend-line but at a solid slope
WTI oil is trading at the trend-line off the 2016 low
The price of oil has been slammed on the coronavirus, and after already being in a vulnerable position following the de-escalation of Iran tensions. Last week, WTI came very near touching the 2016 trend-line on a daily basis, but showed very limited buying interest.
The failure so far to gain any kind of a bid despite heavily oversold conditions doesn’t make yet for a good backdrop for a rally. That could change upon testing of long-term trend support, but if it doesn’t then the risk becomes skewed towards seeing a probing of the December 2018 low near 42.
If soon we see a strong reversal back to the upside, a counter-trend rebound at the least may be in the works. Those looking to play the rebound may have the upper hand at that juncture. From the short-side, it’s a tough spot at the moment for fresh positions with risk/reward unfavorably skewed.

WTI Crude Oil Daily Chart (2016 trend-line)

WTI Crude Oil Chart by TradingView
Trading Forecasts and Educational Guides for traders of all experience levels can be found on the DailyFX Trading Guides page.
Brent oil is below the similar trend-line but at a solid slope
During the precipitous fall over the past three weeks, the Brent contract broke the same 2016 trend-line that the WTI contract is currently trying to hold onto. This has Brent testing a slope that passes under lows starting from August 2016.
Little response so far suggests it could continue its decline. If this is the case it won’t take much more of a drop to reach the December 2018 low only 4 cents beneath the $50 level. Should we see the 2018 depths tested it could finally lead to a meaningful bounce. For now, longs look in need of something to draw more buying interest while shorts don’t hold good risk/reward with support right at the feet of Brent oil.
Brent Crude Oil Daily Chart (at 2016 slope)
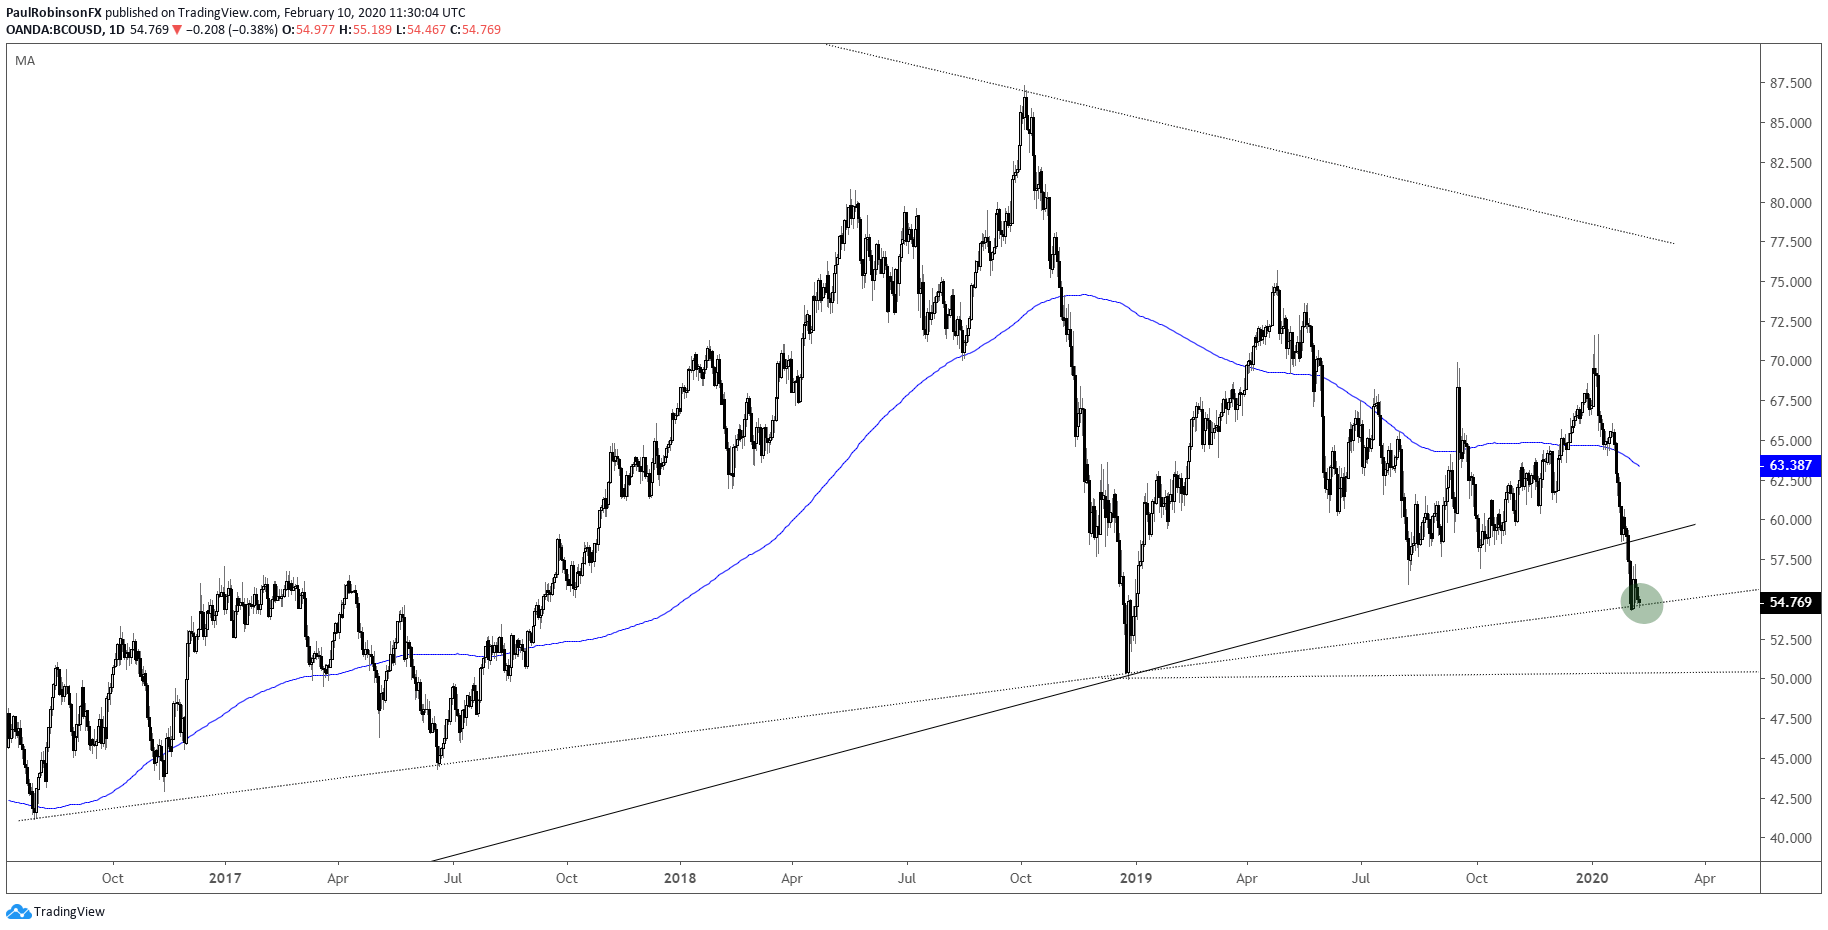
Brent Crude Oil Chart by TradingView
***Updates will be provided on the above ideas as well as others in the trading/technical outlook webinars held at 1030 GMT on Tuesday and Friday. If you are looking for ideas and feedback on how to improve your overall approach to trading, join me on Thursday each week for the Becoming a Better Trader webinar series.
Resources for Forex & CFD Traders
Whether you are a new or experienced trader, we have several resources available to help you; indicator for tracking trader sentiment, quarterly trading forecasts, analytical and educational webinars held daily, trading guides to help you improve trading performance, and one specifically for those who are new to forex.
---Written by Paul Robinson, Market Analyst
You can follow Paul on Twitter at @PaulRobinsonFX


