


Crude Oil Technical Highlights
- WTI crude oil is rallying, but not trustworthy
- Turn down soon may help fill out technical pattern
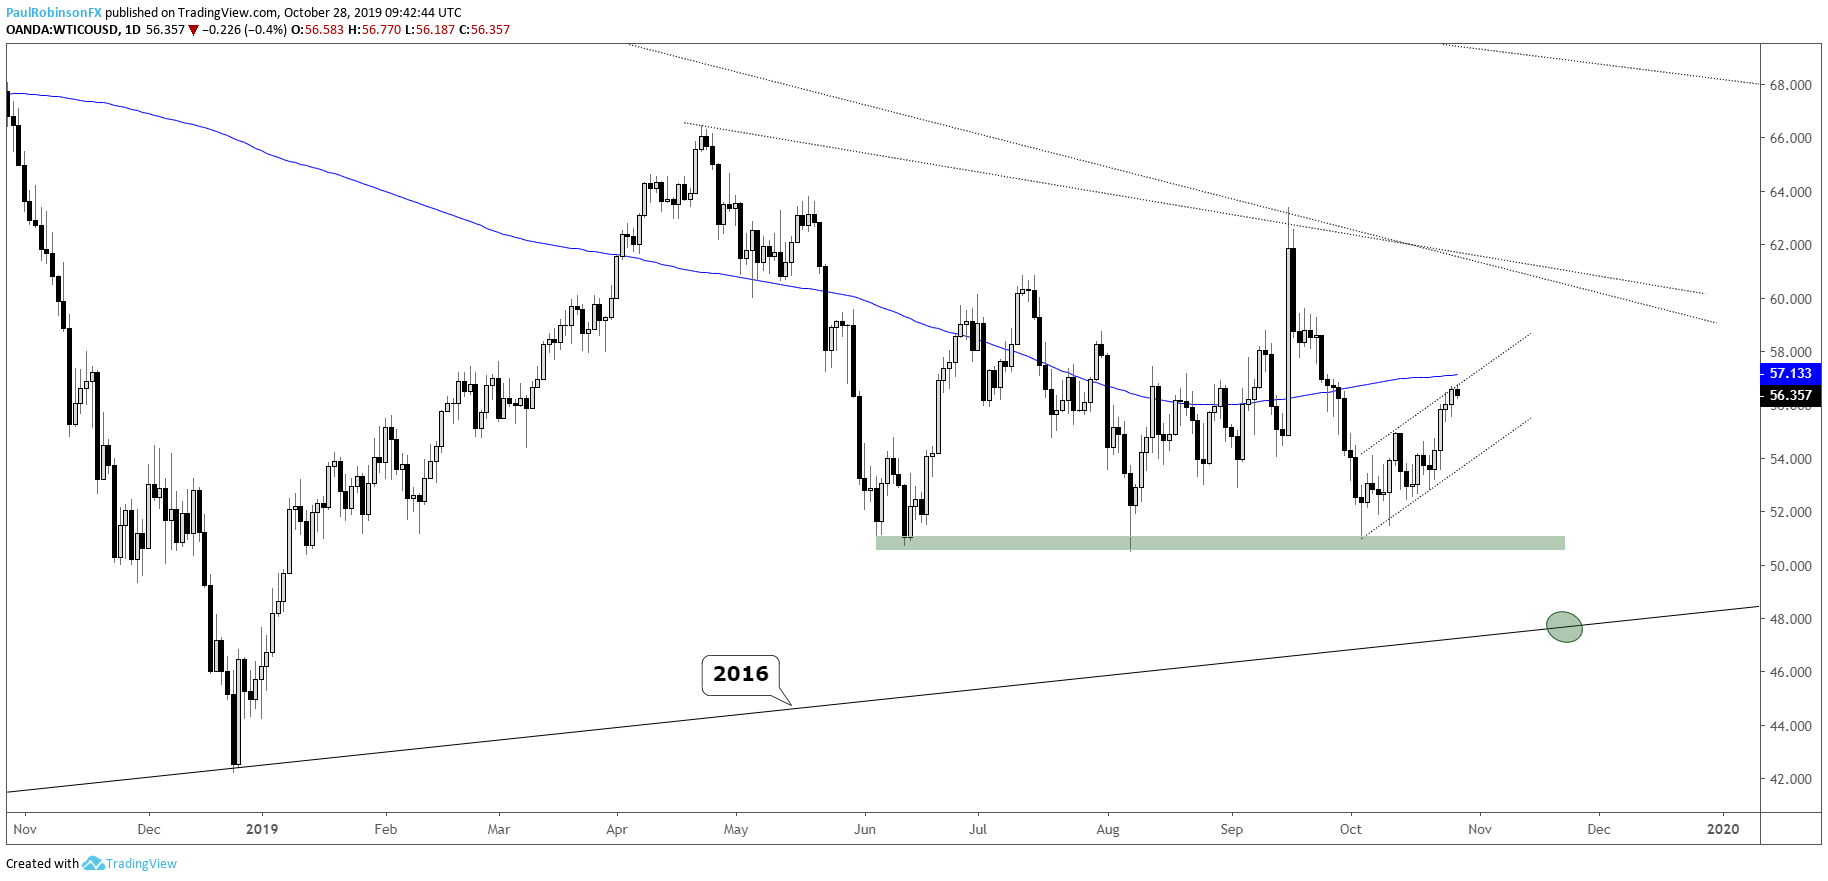
The WTI crude oil contract has been higher for much of the month, with its biggest up day coming on Wednesday. But this recent strength isn’t all that inspiring for higher prices because of the tendency for rallies to fail in recent months.
Oil may want to push a little higher here soon, but watch how price reacts around the nearby 200-day MA. A decline of a couple bucks from current levels, or just a little higher will have in focus the underside trend-line of a developing channel/bear-flag.
The lines are angled upward, and so as long as the lower line holds then the short-term trend, while choppy, will remain higher. A break, however, will have sizable support in the 51/50.50 in focus, an area which has put in a floor on three occasions since June.
The 2016 trend-line remains the target (~48), it has been for quite a while now. The path, though, hasn’t been clear, and getting into a position for a move down to the long-term threshold hasn’t been easy in the absence of a clear driver in oil. Perhaps that will change soon with a break of a clear lower boundary on the developing technical formation.
As far as the upside goes, even if the channel structure were to fall apart with further surging prices, the general tilt of the chart has been down for some time now. This means rallies should continue to be viewed with a wary eye until strength can prove itself.
Trading Forecasts and Educational Guides for traders of all experience levels can be found on the DailyFX Trading Guides page.
WTI Crude Oil Daily Chart (200-day/tech levels)
WTI Crude Oil Hourly Chart (closer look at channel/bear-flag)

***Updates will be provided on the above thoughts and others in the trading/technical outlook webinars held at 930 GMT on Tuesday and Friday. If you are looking for ideas and feedback on how to improve your overall approach to trading, join me on Thursday each week for the Becoming a Better Trader webinar series.
Resources for Forex & CFD Traders
Whether you are a new or experienced trader, we have several resources available to help you; indicator for tracking trader sentiment, quarterly trading forecasts, analytical and educational webinars held daily, trading guides to help you improve trading performance, and one specifically for those who are new to forex.
---Written by Paul Robinson, Market Analyst
You can follow Paul on Twitter at @PaulRobinsonFX


