


Crude Oil Technical Highlights:
- WTI crude oil contract trading confluence of resistance
- Brent postured more precariously than its U.S. counterpart
Check out the intermediate-term fundamental and technical outlook in the Q3 Crude Oil Forecast.
WTI crude oil contract trading confluence of resistance
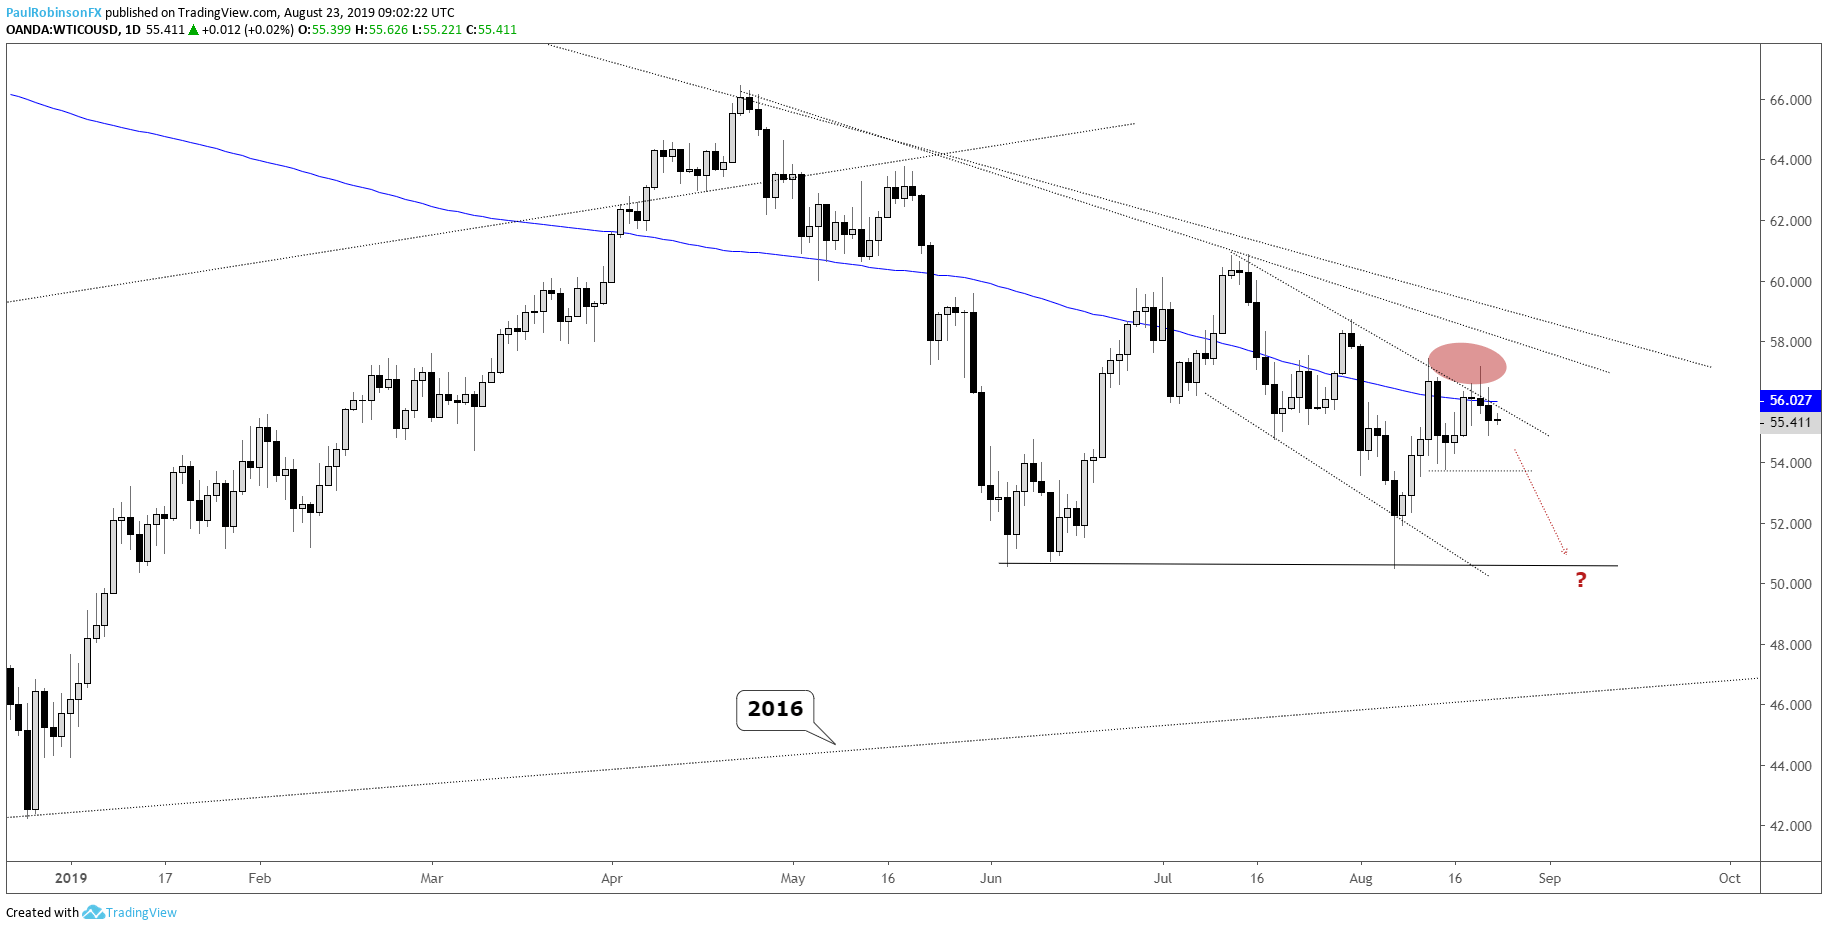
The bounce in WTI crude oil ran aground into a descending upper parallel that is in near confluence with the falling 200-day MA, and this week the battle continues as the area from around 56 up to 57.50 is proving formidable in the near-term.
A turn lower could soon develop. In the event sellers step in here shortly, keep an eye on the 53.74 level, a minor swing-low created during last week’s trade. A sustained break below should have crude oil rolling downhill towards the 50.48 low from earlier in the month.
In the event price holds up and pushes on through the aforementioned resistance, there are a pair of trend-lines from October and April that could prove problematic for an advance to continue. This doesn’t leave much room right now for longs in a trend that isn’t particularly favorable for buyers.
WTI Crude Oil Daily Chart (top of channel, 200-day MA)
Brent postured more precariously than its U.S. counterpart
Brent has been trading heavier than WTI and positioned better for those looking to short oil. It has found opposition recently near the July low and trend-line running down off the July high. The trend favors another push lower, with a pair of trend-lines from 2016 situated not too far below the monthly low.
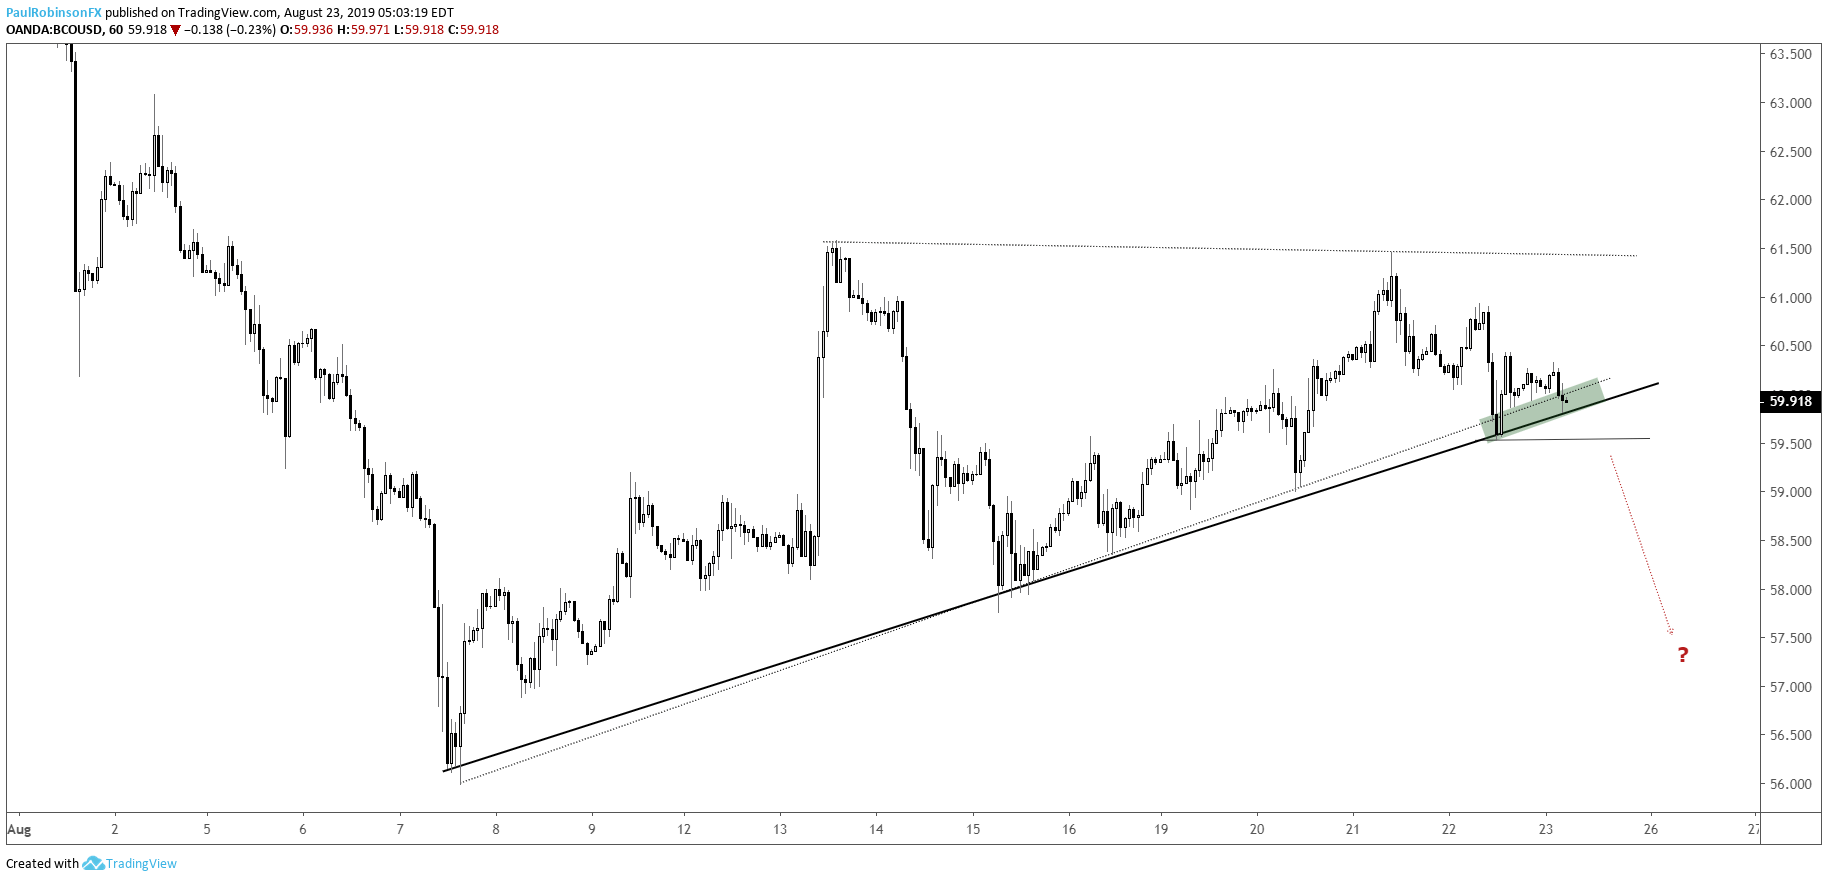
Turning to the hourly chart, a break of a clean trend-line off the monthly low could be all that is needed for momentum to pick up. Brent is teetering on the line now, so a break could come at any time. To confirm the t-line break, a decline below 59.51 should do the trick.
Brent Crude Oil Daily Chart (prior low, t-line)
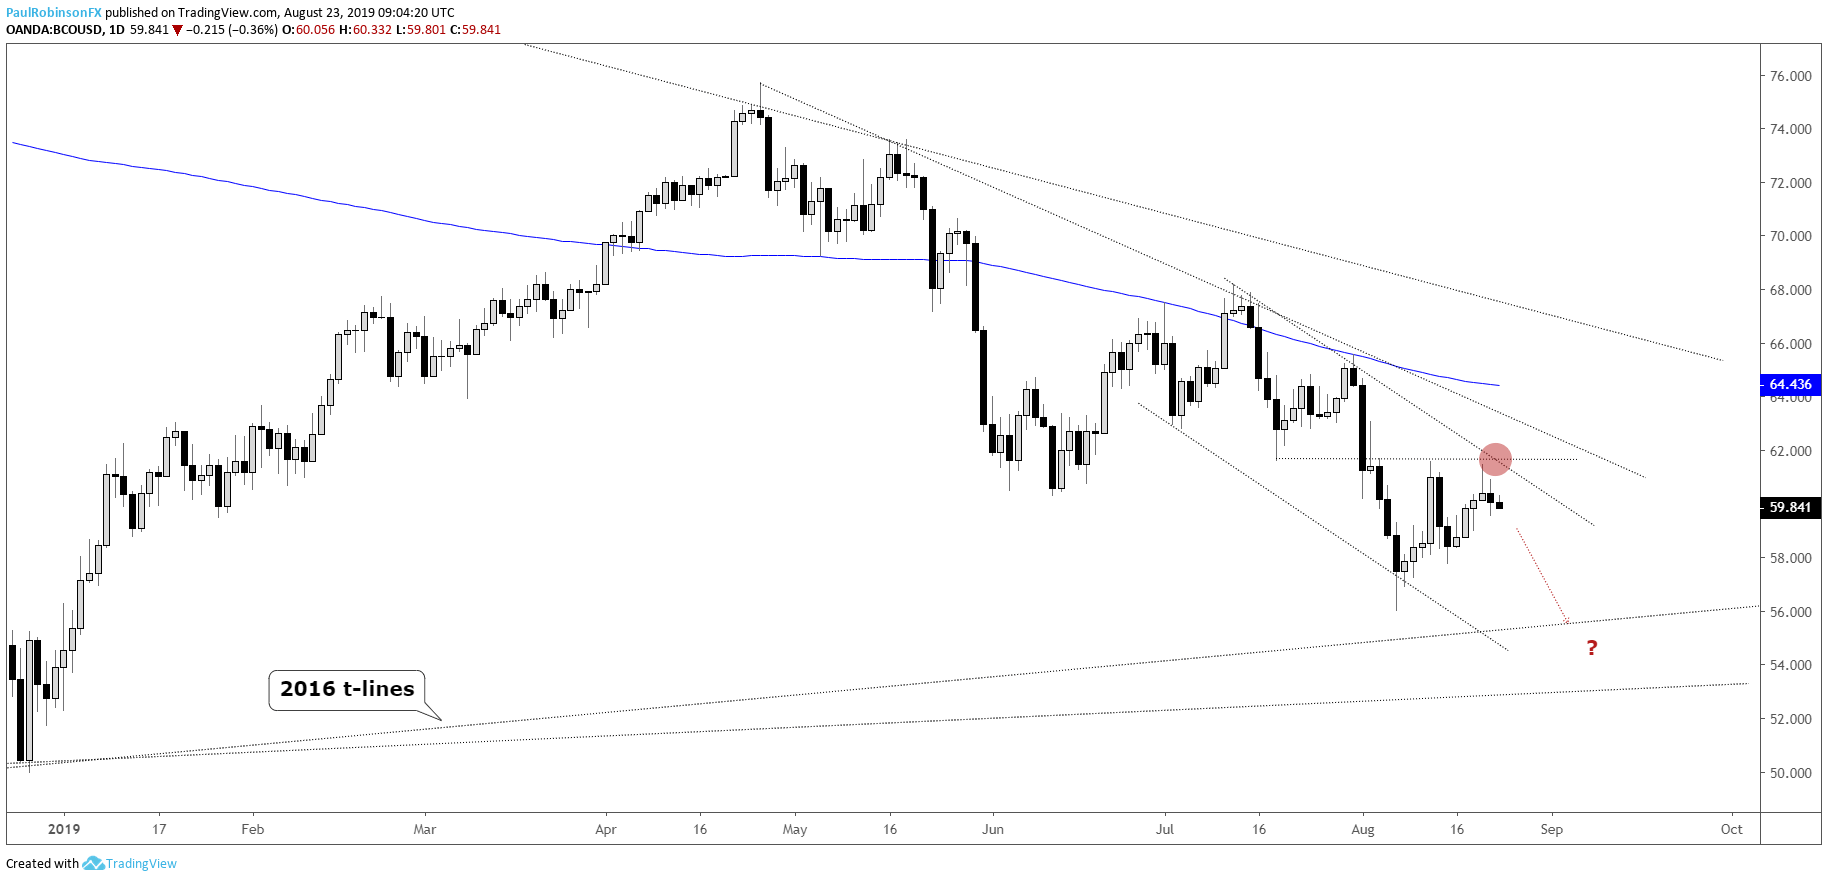
Brent Crude Oil Chart by Tradingview
Brent Crude Oil Hourly Chart (watch rising t-line)
Forex & CFD Trader Resources
Whether you are a new or experienced trader, we have several resources available to help you; indicator for tracking trader sentiment, quarterly trading forecasts, analytical and educational webinars held daily, trading guides to help you improve trading performance, and one specifically for those who are new to forex.
---Written by Paul Robinson, Market Analyst
You can follow Paul on Twitter at @PaulRobinsonFX


