


Crude Oil Price Chart and Analysis:
- Crude oil pulls-back but the move is running out of steam.
- New drivers needed for the next move.
The Brand New DailyFX Q2 2019 Trading Forecast and Guides are Available to Download Now!!
How to Trade Oil: Crude Oil Trading Strategies & Tips.
Crude Oil Needs a New Driver to Continue Pushing Higher
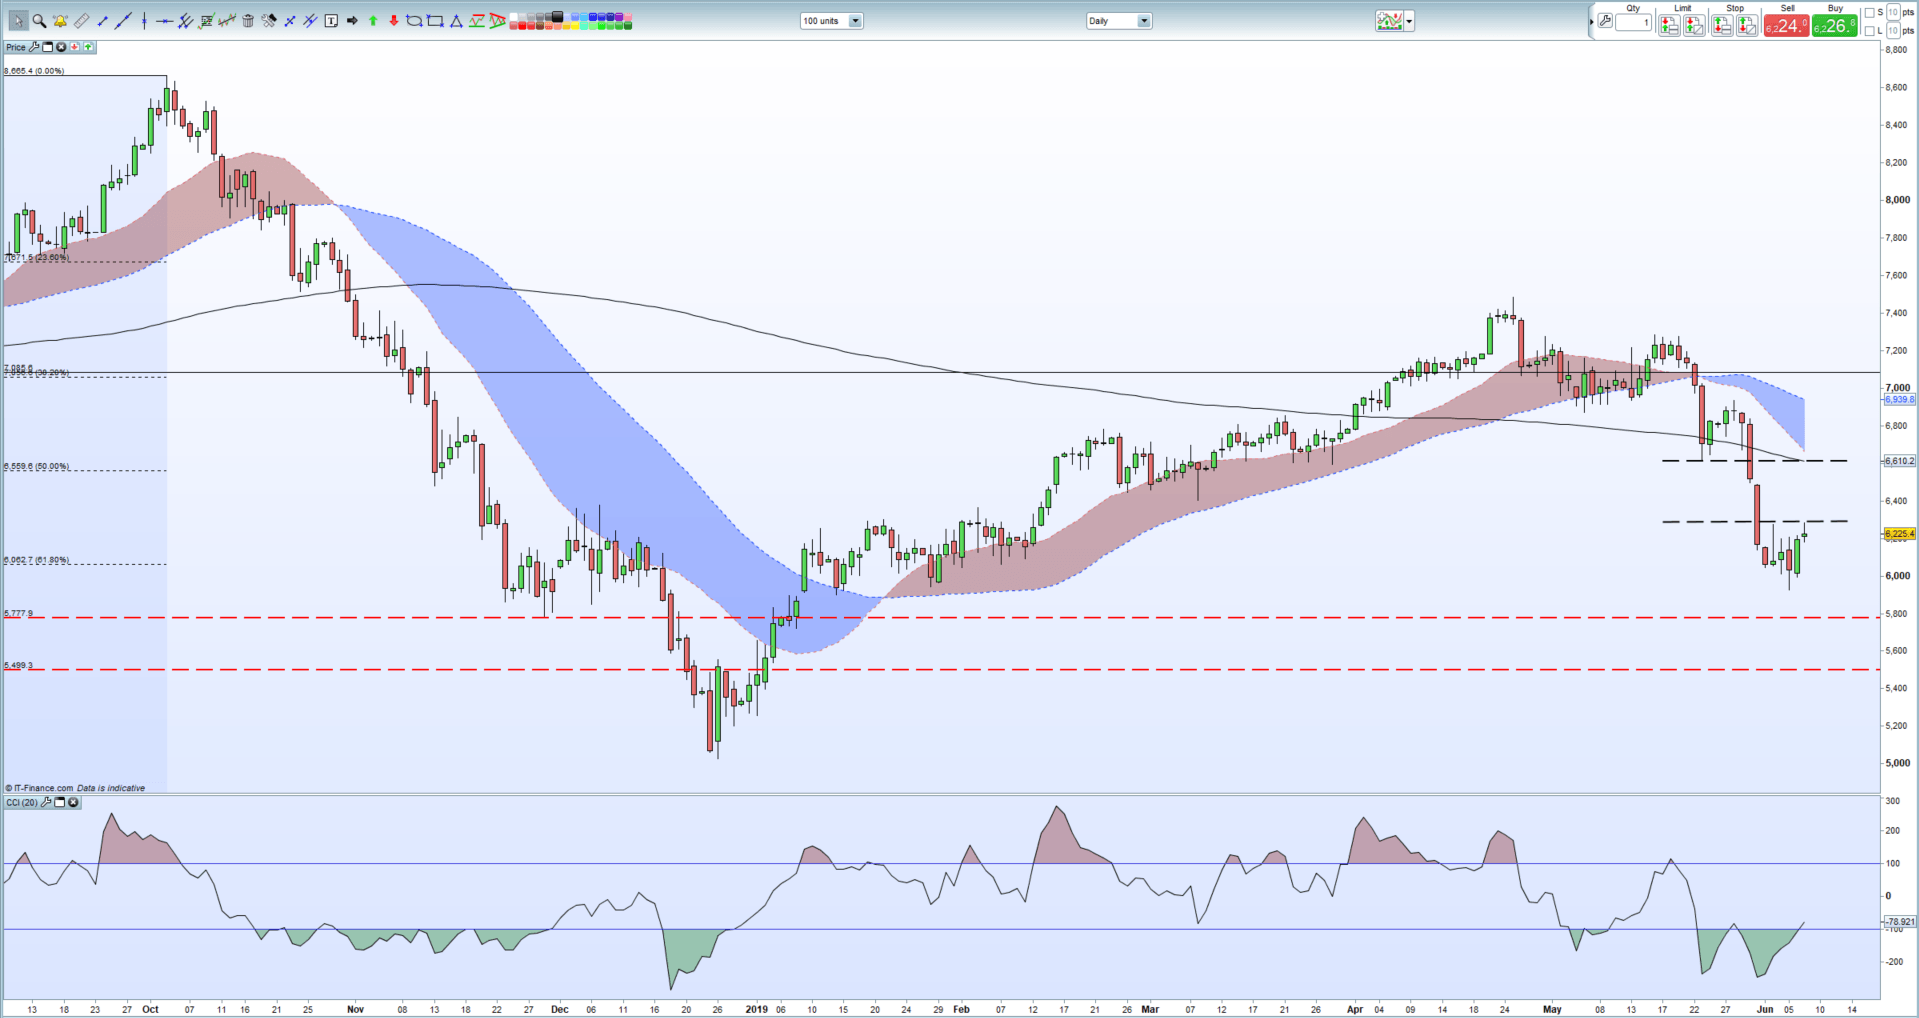
The latest, muted, push-back in the price of crude oil has seen black gold touch a fresh one-week high in thin trade. Crude is now at the bottom of a zone characterized by two sharp sell-off candles, the body of the recent move from the top of the reversal doji (May 28) at $69.40/bbl. to the five-month low (June 5) at $59.22/bbl. The top of this zone also cuts across the 200-day moving average and sits just above 50% Fibonacci retracement at $65.60/bbl. A push back above this zone is likely to need a strong impulse to drive the move.
If this zone is respected, and oil fails to close above $62.75/bbl. then bears may re-test 61.8% Fibonacci retracement at $60.63/bbl. before testing sub-$60/bbl. and the recent low. The recent up-tick has taken oil out of heavily oversold territory, but the current level still indicates weakness.
WTI vs Brent: Top 5 Differences Between WTI and Brent Crude Oil
Crude Oil Daily Price Chart (September 2018 – June 7, 2019)
Traders may be interested in two of our trading guides – Traits of Successful Traders and Top Trading Lessons – while technical analysts are likely to be interested in our latest Elliott Wave Guide.
What is your view on crude oil – bullish or bearish?? You can let us know via the form at the end of this piece or you can contact the author at nicholas.cawley@ig.com or via Twitter @nickcawley1.


