Crude Oil Price Chart and Analysis:
- Fundamentals calm for now as US downplays Iran threat.
- Technical set-up looks interesting with a downside break a possibility.
The Brand New DailyFX Q2 2019 Trading Forecast and Guides are Available to Download Now!!
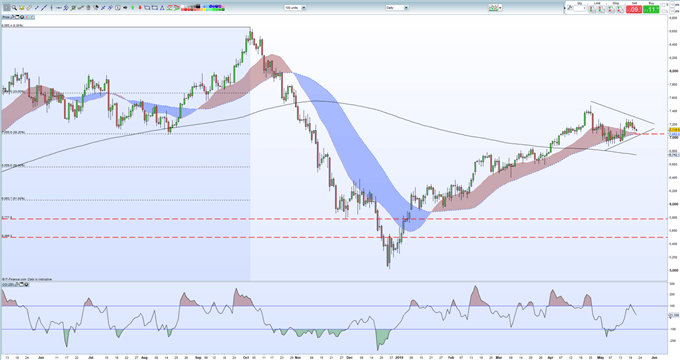
The recent descending triangle off the April 25 multi-month high is now coming to a point with the recent uptrend around a cluster of other technical indicators. A break, one way of the other, may well be likely in the short-term.
The recent escalation in hostilities between the US and Iran have quietened down in the last 24 hours, taking the edge off the recent crude oil rally. While relations are still tense, with both sides warning each other, recent commentary from the US Defense Secretary Patrick Shanahan has eased fears of an outright conflict. Speaking recently Shanahan said that the US’s focus at this point is to prevent Iranian miscalculation. “We do not want the situation to escalate. This is about deterrence, not about war."
The mild easing of hostilities in the past few days is reflected in the price of crude which has gently slipped lower. The chart now shows that the spot price - $71.08/bbl. is now just on top of both the 20- and 5-day moving averages and the 38.2% Fibonacci retracement levels at $70.57/bbl. In addition, oil is now nearing the recent uptrend off the May 6 low at $68.73/bbl. and a test of this support is looking increasingly likely.
How to Trade Oil: Crude Oil Trading Strategies & Tips.
Crude Oil Daily Price Chart (July 2018 – May 22, 2019)

Traders may be interested in two of our trading guides – Traits of Successful Traders and Top Trading Lessons – while technical analysts are likely to be interested in our latest Elliott Wave Guide.
What is your view on crude oil – bullish or bearish?? You can let us know via the form at the end of this piece or you can contact the author at nicholas.cawley@ig.com or via Twitter @nickcawley1.


