Crude Oil Price Forecast Talking Points:
- WTI Crude Oil Technical Analysis Strategy: backwardation continues to breed buyer’s market
- Sanctions look increasingly probable against Iran that could lead to supply shocks in an already tight market
- Trader Sentiment Highlight from IG UK: retail short positions bias favors further advances
The seeming probability of renewed sanctions on Iran by US President Trump increased on Monday when Israeli Prime Minister Benjamin Netanyahu declared in a public presentation this his evidence proved Iran had engaged in more than a decade of nuclear progress.
Unlock our Q2 18 forecast to learn what will drive trends for Crude Oil in a volatile Q2
Netanyahu Goes On the Offensive
Iranian sanctions would be coming at a bad time for the already tight physical Brent crude market that has traded at aggressive backwardation with the IEA already saying supply shocks are more likely to disrupt the markets than supply floods drowning the market. The main argument for the IEA being concerned was the sharp drop in production from some producers like Venezuela. Taking Iran offline would only heighten those concerns.
Recent data shows that even with current market tightening, crude shipments from Iran rose in April to their highest level since sanctions eased in January 2016. Obviously, taking that supply out of the market, regardless of whether sanctions are warranted would equate to a massive supply shock.
Consider the Curve
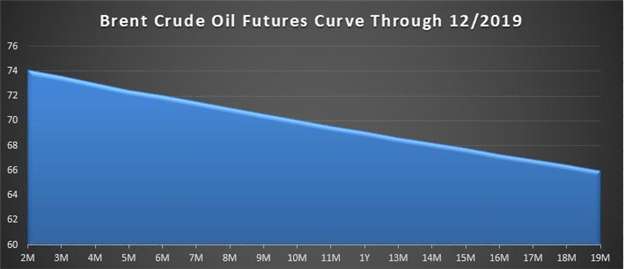
The broader story appears to be displayed by the crude curve, which has shifted aggressively higher and seems to argue that broad bearish bets are early at best, and possibly flat at wrong in the current environment. The market has aggressively shifted from Contango where the backdated contract trades at a premium to the front-month in 2017 to backwardation, where the front-month contract trades at a premium to the later-dated futures contract.
Brent Crude Futures Curve in Backwardation – Present to Dec. 2019

Data source Bloomberg
Backwardation is seen as a proxy for pent-up demand as the carrying costs, insurance, etc. should place a premium on holding a commodity that has to be stored over time unless there is a supply shortage.
Despite the Bullish backdrop, traders are also pricing in the most volatility for Brent, the global benchmark toward last week's 7-month high.
Like much of Wall Street, Big Oil is enjoying a stellar reporting season. What’s unique about oil is that their source of revenue is the source of pain for others as the price increases QoQ & YoY. In other words, while Big Oil seems to be benefiting now, OPEC may have the last laugh as higher Brent prices are supporting their fiscal agendas.
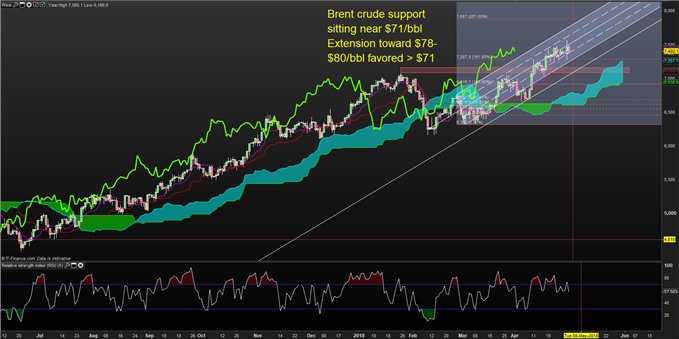
Technical Analysis – Brent Crude Oil Stays In Bullish Standing

Chart Source: Pro Real Time with IG UK Price Feed. Created by Tyler Yell, CMT
Brent crude oil has large support at $71/bbl, a level that aligns with a confluence of technical price floors. While pricing in of volatility is high, the backdrop does seem to favor the path of least resistance as pointing higher.
A strong proxy for short-term Oil strength has been the 9-day midpoint, called the Tenkan-sen on Ichimoku. Currently, with Brent, the Tenkan-Sen sits near $74/bbl and the price has traded above the Tenkan-sen since the April 10 breakout.
Short-term momentum traders would do well not to fight a bullish trend where the price trades north of the 9-day midpoint and can place a trailing stop via the 26-day midpoint, also called the conversion line on Ichimoku.
Not familiar with Ichimoku? You’re not alone and in luck. I created a free guide for you here
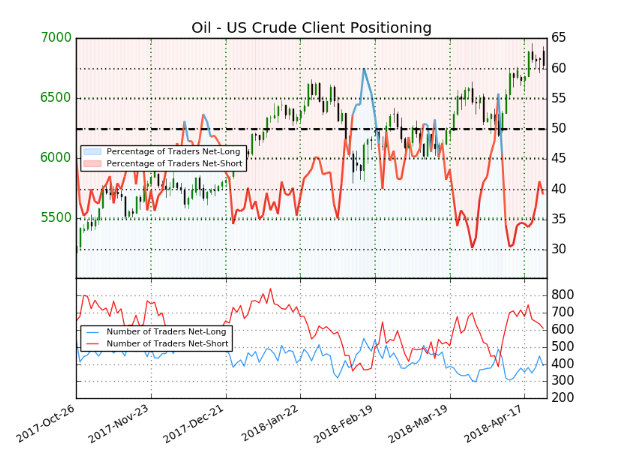
WTI Crude Oil Insight from IG Client Positioning

Insight from IG UK shows us that 41.7% of traders are net-long with the ratio of traders short to long at 1.4 to 1. In fact, traders have remained net-short since Apr 09 when Oil - US Crude traded near 6233.5; the price has moved 9.0% higher since then. The number of traders net-long is 1.4% higher than yesterday and 12.3% lower from last week, while the number of traders net-short is 9.8% lower than yesterday and 8.6% lower from last week.
We typically take a contrarian view to crowd sentiment, and the fact traders are net-short suggests Oil - US Crude prices may continue to rise. Positioning is less net-short than yesterday but more net-short from last week. The combination of current sentiment and recent changes gives us a further mixed Oil - US Crude trading bias (emphasis mine.)
New to FX trading? No worries, we created this guide just for you.
---Written by Tyler Yell, CMT
Tyler Yell is a Chartered Market Technician. Tyler provides Technical analysis that is powered by fundamental factors on key markets as well as t1rading educational resources. Read more of Tyler’s Technical reports via his bio page.
Communicate with Tyler and have your shout below by posting in the comments area. Feel free to include your market views as well.
Discuss this market with Tyler in the live webinar, FX Closing Bell, Weekdays Monday-Thursday at 3 pm ET.
Talk markets on twitter @ForexYell
Join Tyler’s distribution list.


